Prior posts on Vision Zero in category: Vision Zero.
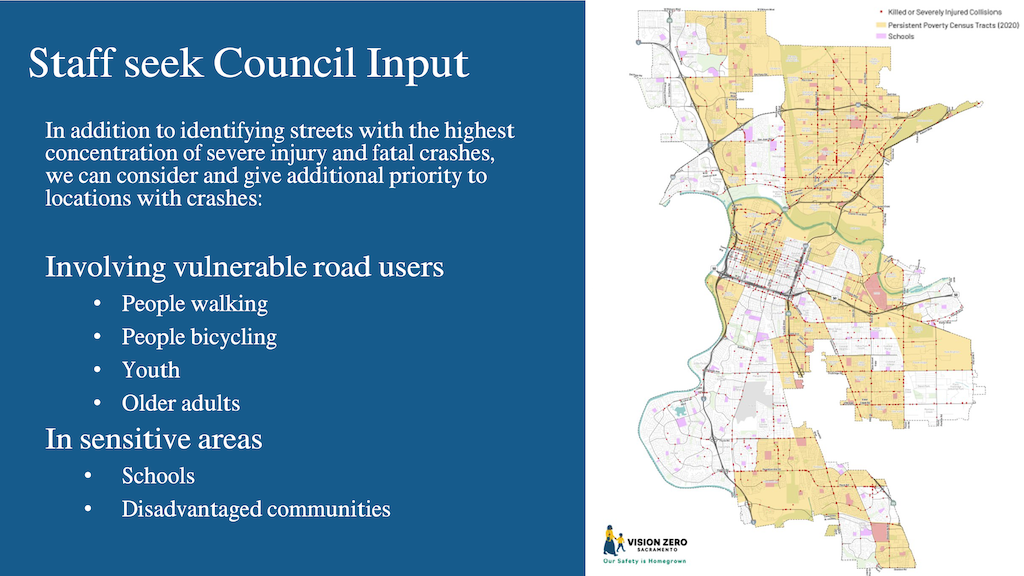
The Sacramento City Council will tonight (2026-03-17 agenda) hear a presentation on the Vision Zero High Injury Network (staff report | presentation) and give direction to staff on whether specific victims or locations should be considered in addition to the pattern of fatal and severe injury locations. New state law allows consideration of and weighting of other victim or location criteria: walking, bicycling, youth, older adults, schools, disadvantaged communities.
This same question was presented to the Vision Zero Task Force (stakeholder) meeting on February 12. I am a member of that group. Participants spoke in favor of most of the ‘vulnerable road users’ and ‘sensitive areas’ criteria, but there did not seem to be a consensus about which criteria, or how to weight them. I’m honestly not sure. There are good arguments for each of them, but there is also an argument for keeping it simple, with just fatality and severe injury locations. The city has already prioritized school locations in many policies and projects, and I’m not sure whether an additional emphasis is needed. The city has over many, many years disinvested in low-income and high-minority communities, so there is a valid argument for making up for that past neglect by prioritizing those areas. And of course people walking are, and have always been, at the bottom of society’s list of people worth investing in and protecting.
What do you think?
Sac Council 2026-03-17 agenda 02, staff seeks council input, page 13
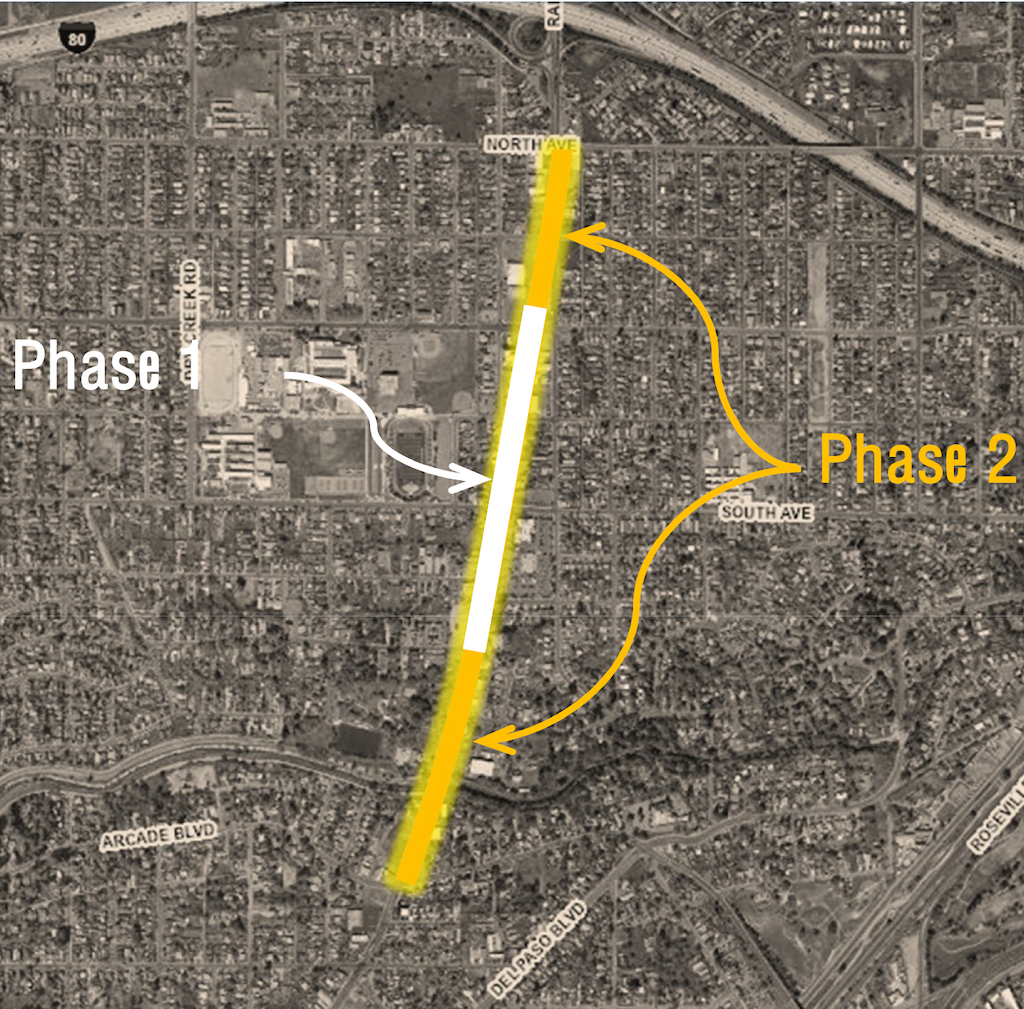
The Marysville Blvd Vision Zero Safety Project, Quick Build Phase 1, started today, Monday, March 16. The overview from the SacATC presentation on September 18, 2025, shows Phase 1, which is from Grand Avenue to Nogales Avenue only. Phase 2 will cover from North Avenue to Arcade Blvd. Phase 2 will include more extensive work, but is not being called a ‘complete streets’ project. Only Phase 1 is fully funded. The city has in the past applied for grants to convert the entire stretch of Marysville Blvd into a complete street, but has been unsuccessful in that effort, which has led to this quick build project in order to improve safety now rather than someday. Phase 1 will cost $1.4M and be completed in 2026. Phase 2 is about $18M and only partially funded.
Marysville Blvd Phase 1 and Phase 2
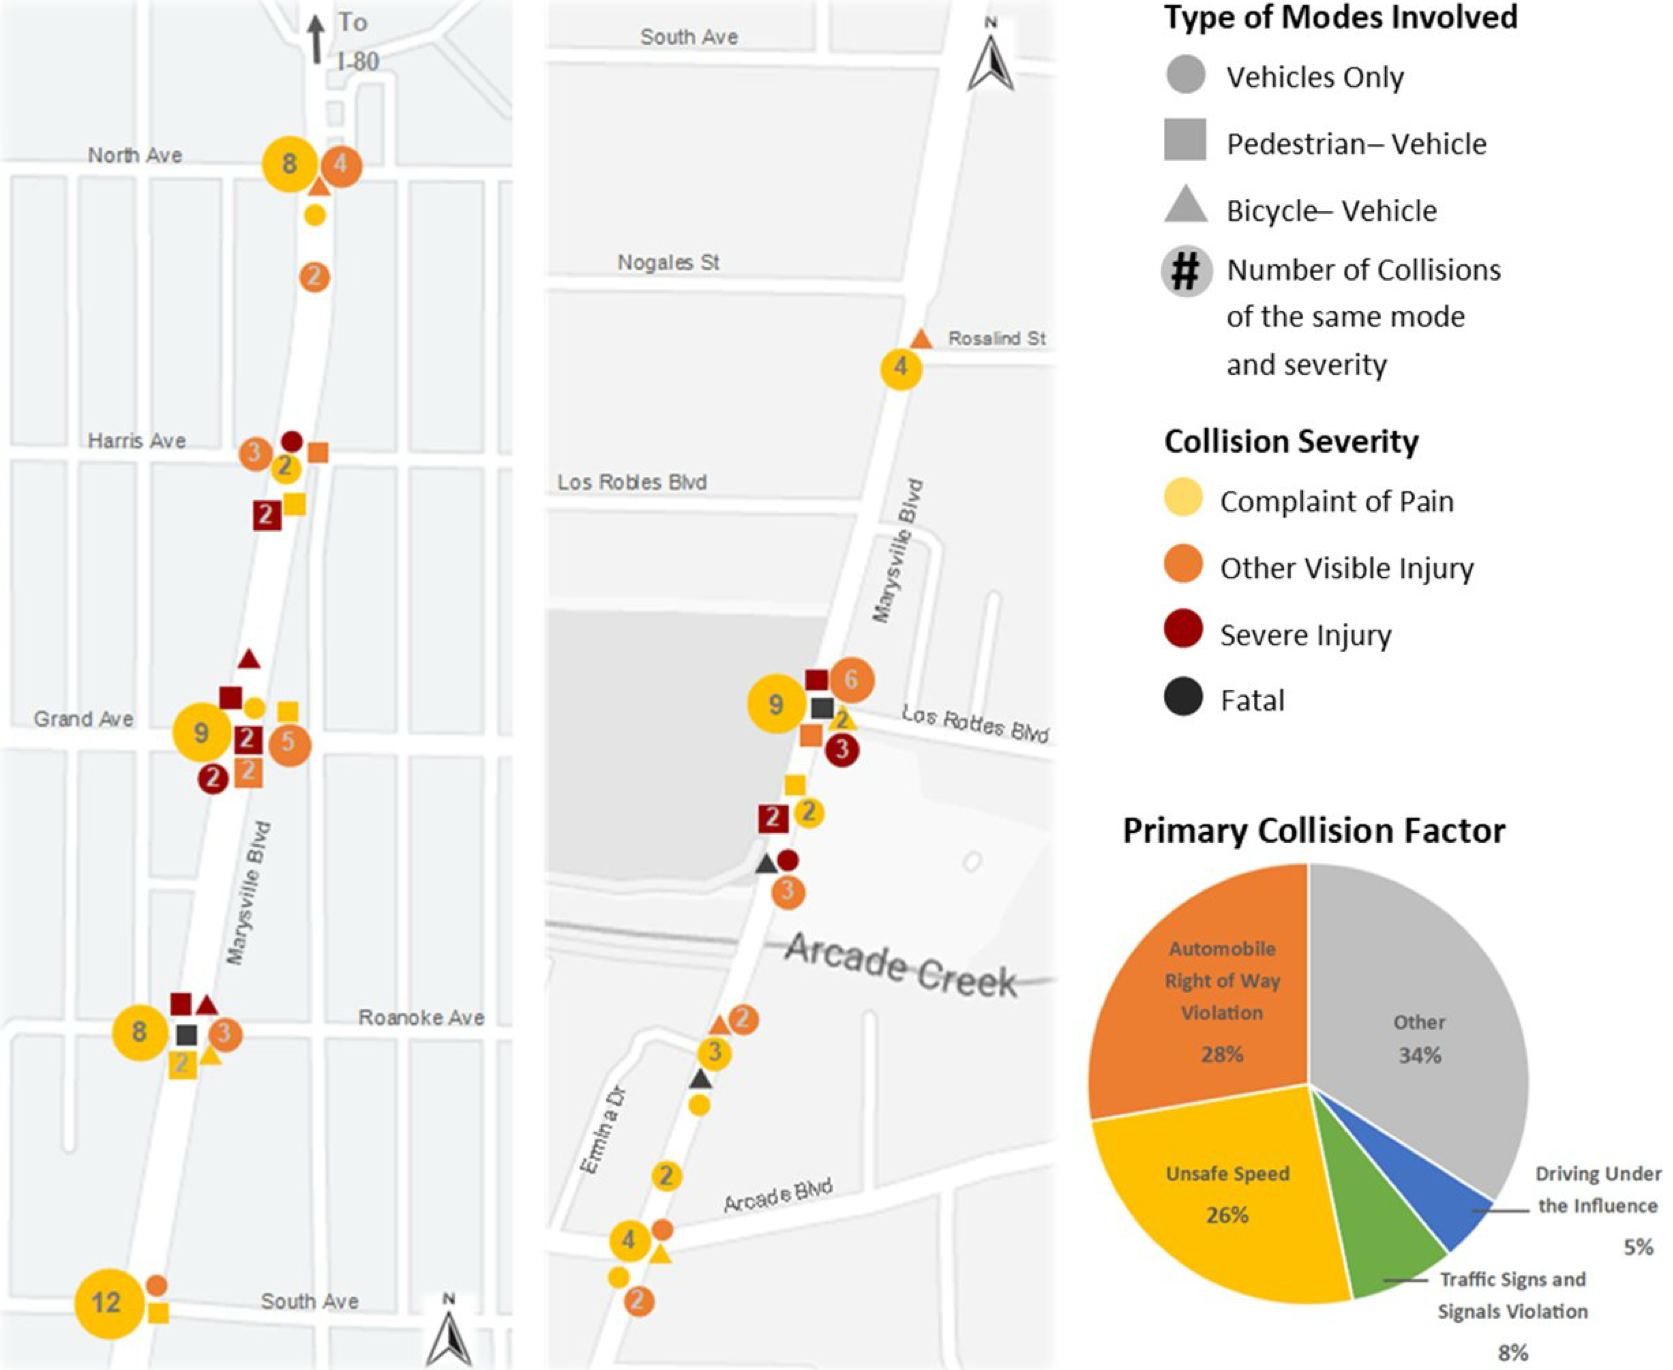
A diagram from the SacATC presentation September 18, 2025, shows collision history for the segment. This is the issue that the city if trying to solve. The diagram is rather dense with information, but of note is that of the four fatalities, three are outside the current phase, and only one is inside, at Roanoke Aveue.
Marysville Blvd is narrowed for construction to one lane, starting just south of Harris Avenue and continuing to south of Roanoke Avenue. During my time of observation, I did not observe any significant backup of traffic, however, it was mid-day, not commute hours.
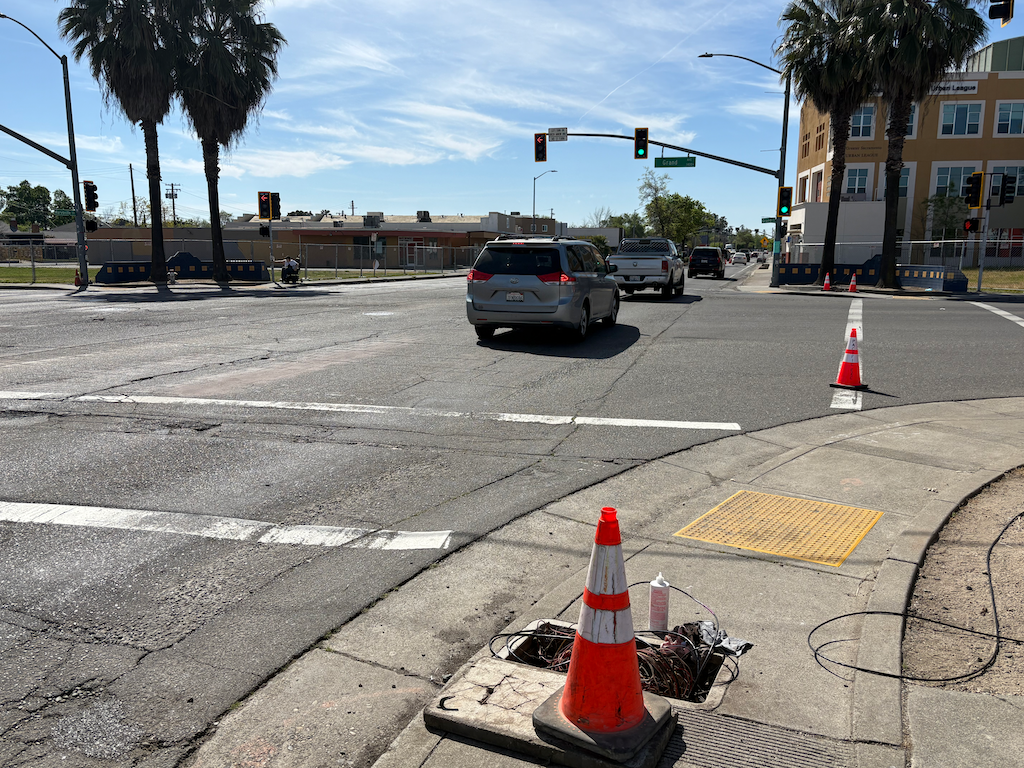
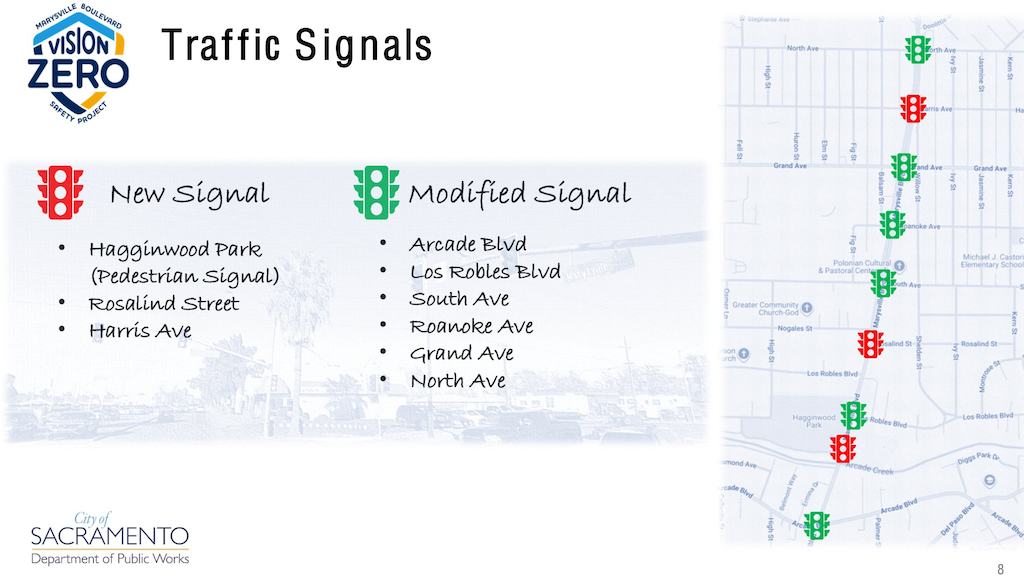
The work on this day is focused on the intersection of Marysville Blvd and Grand Avenue. Signal wiring at the intersection has been exposed and torn up, in preparation for installing a modified signal at this intersection. The diagram from the SacATC presentation on September 18, 2025 (below), shows a modified signal at Marysville and Grand. It is hard to reconcile the signal wiring being torn out with the term ‘modified signal’, but no other information is available.
Marysville at Grand Ave, construction and signal upgradeMarysville Blvd new and modified traffic signals
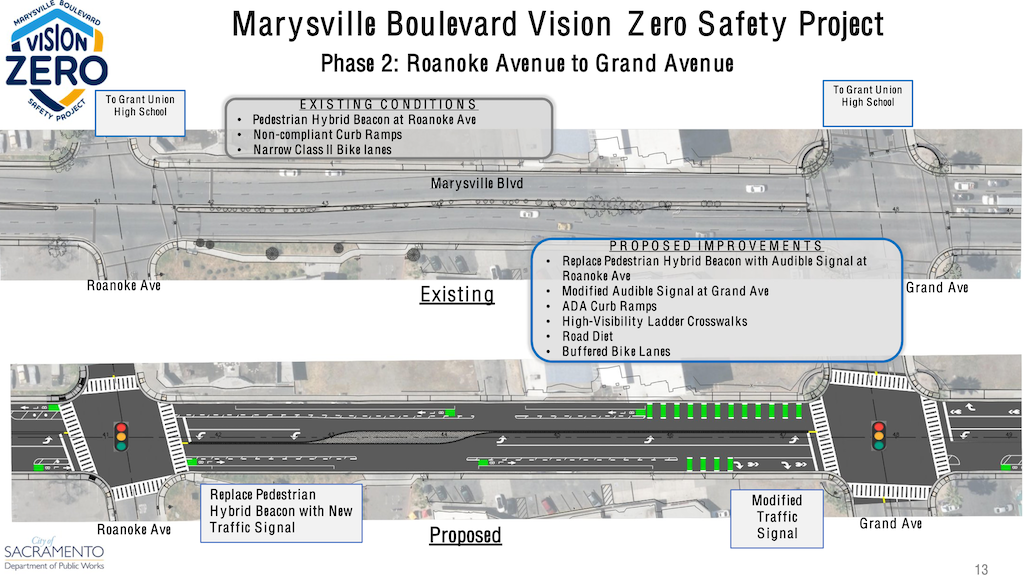
The SacATC presentation on September 18, 2025, includes existing and new for the section from Roanoke Avenue to Grand Avenue, and shows a complete rebuild of the intersection, but this is Phase 2, and it isn’t clear what the intersection and signal will look like at the end of Phase 1. Though the wording is not clear, the pedestrian hybrid signal (HAWK) at Roanoke Avenue may be completely replaced with a new regular traffic signal, but again, in Phase 2. I will have another post on Phase 2, but this one is focused on the Phase 1 Quick Build.
Future post will follow the construction project, and look more closely at Phase 2.
So far as I can determine from the presentation diagrams and the plan diagrams, no sidewalk improvements other than ADA ramps at intersections are planned. Though there are sidewalks nearly throughout the segment, they are narrow and unbuffered. The majority of the driveways ramps are sloped, many to such as degree that they present a barrier to wheelchair travel.
Sadly, most of this segment of Marysville Blvd is characterized by closed businesses, long abandoned buildings, and empty lots. This is not to denigrate the existing businesses, health services, and parks, but it will take much more than this project to energize this corridor. This is an area that has been disinvested by the City of Sacramento since it became part of the city, and it shows. A Marysville and Del Paso ‘Forward Together’ Action Plan lays out some of the actions necessary to heal this community.
The approach of the previous Vision Zero Action Plan (2018, with minor update 2023) was to seek grants from federal, state and regional (SACOG) sources to implement complete streets projects on corridors. For some corridors, grants were received and implemented, or are in progress. For other corridors, the grants were not received and nothing has occurred. As presented in previous posts (category: Vision Zero), I believe this approach is why Vision Zero has failed in the city. We have far too many dangerous roadways to ever fix, with grants or without. We must use other methods, though continuing to implement major projects, so long at they don’t take away a focus on what can be done now, and best use of staff time (it takes hundreds of hours of staff time to write and submit a grant application).
Instead, the city must fund Vision Zero directly. A good start would be an allocation of $20,000,000 in the 2026-2027 budget. That amount would be increased every budget cycle until there is a documented downward trend in fatalities and serious injuries of at least 10% per year.
Where would the money come from, in this time of budget deficits? Let me be blunt. Out of the police department budget.
The police department received $256,280,944 in the 2025-2026 budget, including $9,156,810 from Measure U, which should have been spent on other priorities. This is more than the entire Public Works budget of $237,586,768, which includes everything the city does to maintain and enhance the transportation network, including efforts to improve the safety of our roadways. Fatalities related to violent crime, and fatalities related to traffic violence, are about on parity in the city, competing for the top spot, with traffic violence usually coming out on top. We should be investing just as much to reduce and prevent traffic violence fatalities as we do to respond to – not prevent – violent crime. Is a life claimed by mis-designed and unsafe roadways, particularly of vulnerable users, walkers and bicyclists, of less value than a life claimed by violent crime? I don’t think so, but our existing budget priorities say yes.
A shift of $20,000,000 from the police budget to Public Works, specifically allocated to Vision Zero, would be a minor reduction of the police budget but a major step towards reducing traffic violence and fatalities.
City Council has consistently increased the police department budget while reducing the budget of other departments. That seems to be the politically expedient thing to do, but it is not the courageous action necessary to address our real problems in the city.
From the 2025-2026 budget: “The Public Works Department is dedicated to maintaining safer streets, sustainable infrastructure, and innovative mobility solutions. Over the past year, we have implemented tens of millions of dollars in transportation improvements, expanded electric vehicle charging and transit access, enhanced traffic safety, and completed critical road and facility upgrades. Additionally, the department has strengthened parking management through expanded permit programs and automated enforcement, while continuing to improve operations at the Sacramento Marina to better serve the boating community.”
Corrections: Crash data is from Sacramento Police Department, not SWTRS, but does use the SWITRS selection categories. Demographic data is from the Transportation Priorities Plan.
The City of Sacramento has released a VZ Crash Dashboard with an interactive map and charts. The dashboard apparently uses data from SWITRS for crash data (which means that it will never be up-to-date, as SWITRS is never up-to-date, but patterns don’t depend on up-to-date data), but is selected for the City of Sacramento, and also has demographic data layers for ‘SB 535 disadvantaged communities’, ‘neighborhoods that lack transportation infrastructure’, and ‘communities that have been recipients of racism and bias’. You can turn on and off layers, and can select for crashes on a wide variety of criteria, such as ‘severity’ (fatality, severe injury, etc.) and ‘involved with’ (bicycle, pedestrians, etc.), which are criteria from the SWITRS database.
I have only explored the data in a superficial manner, but noticed some interesting geographic patterns. If you look at crash density, the central city looks bad, but for fatalities only, it looks better than many parts of the city. There are several arterial roadways that were identified as high injury network (HIN) corridors but were not in the Vision Zero Action Plan. However, a visual representation does not necessarily reflect the details of data.
What patterns do you see in the crash dashboard?
VZ crash dashboard map, selected for severity = fatal
It is likely that council member Caity Maple, along with Mayor Darryl Steinberg and council member Karina Talamantes, will introduce an emergency declaration on traffic safety at the city council meeting tonight, starting at 5:00 PM. The item is not on the agenda, so I presume it will be introduced during the ‘Council Comments-Ideas, Questions’ part of the agenda, after all the numbered agenda items. Council members get their ‘matters not on the agenda’ time, just like the public does. None of the advocates I have asked have a clear picture of how emergency declarations work. I presume the idea will come back to council one to many times in the near future, but tonight is your first chance to hear what the council has to say and comment on the ideas.
Caity Maple has posted about the recent injury (now fatality) and the emergency response she wants the city to take:
I’m devastated to see yet another person critically injured after being struck by a vehicle on Sacramento’s roads. Even beyond our City’s commitments to eliminate traffic deaths through Vision Zero, we need to take immediate and urgent action. This coming Tuesday, alongside my colleagues Mayor Darrell Steinberg and Mayor Pro Tem Karina Talamantes, I will be introducing a proposal that:
Declares a state of emergency for the City of Sacramento regarding the road safety crisis
Directs the City Manager to identify funding for a public education campaign focused on driver education, pedestrian/ bicyclist awareness, and traffic safety
Directs the City Manager to work with SacPD to ramp up enforcement of traffic laws that protect pedestrians, including speed limit enforcement, crosswalk violations, and distracted driving, especially in high-injury corridors
Reaffirms our commitment to Vision Zero and directs staff to expedite safety projects
The City of Sacramento adopted Vision Zero in 2017, and developed a Vision Zero Action Plan in 2018. The plan identified five high injury corridors for projects to slow traffic and increase safety for walkers and bicyclists. The city then developed a plan for these five corridors in 2021. The city has obtained grants for some of these corridors, and will apply for more. The city lowered speed limits in a number of schools zones (though street design, drop-off/pick-up procedures, and motorist behavior are the issues in most school zones, not speeding). The city also developed a public outreach education program, though there is no evidence of such programs having any effect on driver behavior (NHTSA and California OTS have thousands of programs with no demonstrated success). So far, so good.
But…
The city has intentionally ignored high injury intersections, unless they are on one of these corridors. No grant applications have been made to fix intersections, though intersections are where most fatalities and severe injuries occur. No non-grant actions have been taken to fix high injury intersections.
The city has failed to set up a crash investigation team to determine causes and solutions for every fatality. The police department (or CHP if the crash occurs on a state highway) will do an investigation, and sometimes involve traffic engineers, but never involves planners, never involves experts in nonprofit organizations (who have as much if not more expertise than city staff), and never involves citizens who walk and bike.
The Vision Zero Task Force, which met in 2016 and 2017, has never met since. That means there is no community guidance for the Vision Zero program. City staff is making all the decisions on Vision Zero.
The city has ignored all the low cost options for reducing motor vehicle crashes. As just one example, the city has been asked to remove pedestrian beg buttons and create leading pedestrian intervals (LPIs) at all signalized intersections, but did only a small beg button set to auto-recall on five crosswalks, and have not increased the number of LPIs in years.
Solutions?
The city should create an effective crash investigation team, composed of law enforcement, city traffic engineers, city planners, nonprofit experts, and citizens who walk and bike, and perhaps a representative of the neighborhood association in which the crash occurred. The team should never be led by law enforcement, which has an anti-walker and anti-bicyclist windshield bias. It has been suggested that streets where fatalities have occurred be shut down until the investigation and resulting fixes are in place, which is an idea worth considering.
The city should identify the top five high injury intersections, and commit to significant changes to eliminate crashes at those intersections, within three years. And then move on to the next five. The corridor projects and intersection projects should be considered co-equal in city funded projects or grant applications.
The city Active Transportation Commission should take on a strong leadership role in advising the council on the Vision Zero program. It may also be appropriate to re-convene the task force to provide more detailed guidance to staff.
The city should implement a Vision Zero project to change all traffic signals in the entire city to auto-recall (with removal of the physical beg buttons as staffing allows) and leading pedestrian intervals.
The city should undertake a review of peer cities that have reduced speed limits city-wide, to determine whether to implement this change and how to learn from the experiences of other cities. If the review indicates that speeds can be reduced by as little as 3 mph by a reduction from 25 mph to 20 mph, the city should implement it city-wide. Similarly for higher speed streets.
Many organizations and individuals are deciding to oppose the transportation sales tax measure being proposed for the November 2022 ballot in Sacramento County. The reasons for opposition are many, but previous posts here (Measure 2022) cover significant ones. If the measure does not qualify for the ballot, or does qualify and fails, what then are we to do for transportation? Below are some ideas for a safe and effective transportation system. They are not yet well organized or prioritized.
I acknowledge the contribution of Walkable City Rules by Jeff Speck to this list. If you haven’t read it, please do. I don’t agree with everything he says, but it is the best prescription for correcting our transportation system and healing our cities that I know of. See also Measure 2022: the path not taken.
The realities of climate change and social justice demand a radical redesign of our existing transportation system and radical shift in transportation policies and investments. More of the same, with slight improvements, as the sales tax measure suggests, will not serve our needs now or in the future. See also our racist and classist transportation system.
General
all projects must contribute to or be neutral in reaching regional (SACOG) and state goals for reducing VMT and GHG (vehicle miles traveled, greenhouse gas emissions)
travel modes will be prioritized as: 1) active transportation (walking and bicycling), 2) transit, and 3) motor vehicles
Equity
sales taxes are regressive, and will not be the default mechanism for funding transportation projects
travel needs of people who don’t or can’t drive (children, elderly, disabled, choice) will receive at least the same concern and investment as those who do drive
at least 60% of transportation investments must serve formerly underinvested communities
transportation projects will be selected and designed to meet community needs previously expressed through community engagement; projects will not be selected by transportation agencies or employees
anti-displacement measures will be included in all transportation projects
no investments will be made in transitioning motor vehicles from fossil fuels to electric or hydrogen, except where formerly underinvested communities need supporting infrastructure; transitioning vehicles away from fossil fuels merely maintains motor vehicle dominance of our transportation system
all projects over $10M will require a health impact analysis
agencies will educate the public about H+T (housing and transportation) costs as a measure of housing affordability
Policies
roadways will be maintained in a state of good repair to serve all travel modes
transportation planning will be integrated with land use planning
only agencies that acknowledge and plan around induced travel demand will receive transportation funding
all transportation agencies must implement a robust complete streets policy which includes frequent, safe crossings of roadways and speed reductions
congestion pricing will be considered as a solution in all dense urban areas, to reduce motor vehicle travel and to fund transportation projects; pricing will be based at least in part on vehicle weight, value or emissions
cities and counties will not accept responsibility for maintaining local roadways in new developments; therefore, new development must establish reserve accounts to cover ongoing maintenance
Vision Zero
all transportation agencies must establish and implement Vision Zero policies in which redesign of roadways is a preferred action
at least 25% of transportation funds must be spent on Vision Zero projects
all roadway fatalities will be analyzed using a safe systems approach, with required change to the roadway design or use to prevent future fatalities
Roadway Design
implement 10-foot or less travel lanes whenever a roadway is repaved; remove striping from local streets
all new developments will require a grid street system of one-eighth mile so that the need for arterials and collectors is reduced
consider all right-turn-only and left-turn-only lanes for elimination
eliminate slip lanes everywhere
require signal cycles to be 90 seconds or less
eliminate level-of-service (LOS) in transportation planning
conversions of one-way streets to two-way streets will be funded; one-way one-lane streets will be considered an acceptable design for local streets and central cities
overly wide roadways will be reduced, with unneeded right-of-way returned to adjacent property owners or sold for infill housing
rougher pavements such as brick will be considered whenever slower traffic speeds are desired (but crosswalks will be smoother than the pavement)
Traffic Enforcement
wherever possible, automated enforcement will be used to enforce vehicle code that protects vulnerable users, rather than direct enforcement by law enforcement officers
violations which to do not threaten the safety of other roadway users will be de-prioritized or removed, with reduced fees if maintained
temporary or permanent vehicle confiscation will be used for egregious violators of vehicle codes
cities and county shall have the authority to do city-wide and county-wide reductions of posted speed limits, with or without corresponding changes to roadway design; redesign is of course preferred
Parking
all on-street motor vehicle parking in urban areas will be charged, either through curb metering or though flat fees
parking fees will be used to:
cover the cost of providing on-street parking construction and maintenance, and parking enforcement
improve transportation and economic vitality within the neighborhood that generates them, and therefore will not go into the general fund
parking minimums will be eliminated
de-couple parking from rent so that car-free renters are not subsidizing renters with cars
parking will be managed to maintain a level of availability on every block (similar to the Shoup 85% rule)
removal of on-street parking for higher uses such as active transportation, dining, and community spaces will be supported; however, removal of a travel lane rather than removal of parking is preferred
remove parking upstream of intersection corners to ensure visibility (daylighting); not needed when curb extensions provide the visibility
parking lanes/areas will be maintained to a reduced and less expensive level than roadways
Freeways
freeway removal, reduction, or decking will be considered for all freeways
new interchanges must be 100% paid for by private development
in urban areas, reconnect street networks over or under freeways at no less than one-half mile intervals, and provide pedestrian and bicyclist connections at no less than one-quarter mile intervals
managed lanes must be converted from general purpose lanes, not created through capacity expansion
Transit
transit performance measures will be developed, with a tentative goal that 80% of the population is served by 15 minute or better frequency bus or rail service, within one-half mile, for at least 15 hours per day on weekdays and 12 hours per day on weekends
transit will not be used as a mitigation for roadway expansion or induced motor vehicle travel; transit is a desirable mode in and of itself
transit will be funded to at least the equivalent of one-half cent of sales tax
dedicated bus lanes or bus rapid transit (BRT) design will be implemented on all high ridership bus routes
transit agencies will have flexibility to allocate funds between capital, maintenance, and operations, based on established criteria
metered freeway on-ramps serving four or more regular (non-commute) buses per hour will have bus bypass lanes
Sidewalks and Crosswalks
sidewalks will be considered an integral part of the transportation network, and therefore maintained by transportation agencies rather than property owners, except where trees or work on private property impacts the sidewalk; buffer strips in which trees are planted will be considered public responsibility
sidewalk infill will be considered a primary use of transportation funds, with at least 60% going to formerly underinvested neighborhoods
sidewalks with driveway ramps that slope the sidewalk crosswise will be replaced with continuous flat sidewalks, or the driveway eliminated
all traffic signals that have a pedestrian signal head will be programmed with a leading pedestrian interval (LPI) of at least 3 seconds
required pedestrian-activation will be eliminated (buttons to trigger audible information are acceptable); pedestrian auto-detection will be considered
raised crosswalks or raised intersections will be the default design for all reconstructed intersections
all crosswalks will be marked, with the possible exception of purely residential areas
pedestrian crossing prohibitions will be analyzed and eliminated where not strictly necessary for safety
curb extensions, the width of parking lanes and designed to not interfere with bicycling, will be installed whenever intersections are modified or reconstructed
Bicycle Facilities
bike facilities on any roadway with a posted speed limit over 30mph must be separated (protected) bikeways
bike facilities on any roadway with a posted speed limit over 40 mph must be separated from the roadway
roadway design will be used to make bicycle facilities unnecessary on low speed streets
design and implement low-stress bicycle networks
prioritize filling gaps in the bicycle network
re-stripe or re-design roadways so that bike lanes or separated bikeways are not dropped at intersections
bike share, and possibly scooter share, will be supported with transportation funds
secure, on-demand bicycle parking will be provided at common destinations; bicycle racks will be provided at common destinations and on every block in urbanized areas
Schools
school districts will have the authority to close roadways fronting the main entrance to a school, during arrival and dismissal times, in order to increase student safety and protection from air pollutants
Safe Routes to School programs or similar will be supported by transportation funds at the local level
school districts will be prohibited from building new schools at locations which are not easily accessible via active transportation or transit
school districts will prioritize neighborhood schools over magnet schools, in order to reduce travel
school districts will develop policies that allow neighborhood schools to remain open under declining enrollment
school districts will be responsible for the same transportation demand management requirements placed on any other entity
Thank you if you read all the way through. I realize some of these are radical ideas, but radical ideas make space for more reasonable ideas provided by others. That is part of the purpose of this blog.
The City of Sacramento has 11 red light camera locations: Red Light Running Program. Of these, some are at high-injury intersections, but most are not. These locations are cross-referenced with high injury intersections shown in the post Sac Vision Zero new intersections map.
Location
Top all
Top ped
Top bike
Mack Rd & La Mancha Way/Valley Hi Dr
no
no
no
El Camino Ave & Evergreen St
no
no
no
Howe Ave & Fair Oaks Blvd
no
no
no
Mack Rd & Center Parkway
no
no
no
Exposition Blvd & Ethan Way
no
no
no
Broadway & 21st St
no
no
no
Folsom Blvd & Howe Ave/Power Inn Rd
no
no
no
Arden Way & Challenge Way
no
no
no
5th St & I St
no
no
no
16th St & W St
no
no
no
Alhambra Blvd & J St
no
no
no
My first thought is that the city was putting these cameras in the wrong location. But then I thought, what if the presence of red light cameras is making these locations safer and therefore dropping them out of the highest injury intersection list. I don’t have the information to answer that question, which would take analysis of crashes at the intersections, and before/after data.
What I do know is that many more red light cameras are needed to counteract the pandemic of red light running: pandemic of red light running. I spend time around the edges of Fremont Park, close to where I live, which includes the intersection of arterial streets P, Q, 15th, and 16th, and one of the things I do is watch traffic in the intersections. It has now become rare for a signal cycle for 16th St northbound at P St to not see an incidence of red light running. The other intersections are not quite as bad, but the pattern is there. And this is happening everywhere in Sacramento that I go; these are not likely to even be the worst intersections.
I believe that most of the red light running is by egregious violators, people who routinely and continuously violate traffic law for their own convenience or thrill seeking. This is true of most traffic violations, but red light running is the one most likely to result in fatality and serious injury, for people in all modes of travel. So having a more widespread set of red light cameras would serve to catch these red light violators. Of course the follow-up is necessary, to revoke the licenses and confiscate the vehicles of these repeat offenders. The longer the city looks the other way on this issue, the more people will come to see it as normal behavior, and the less safe our streets will be.
The standard response by cars-first entitled drivers is that tickets are just a money-making scheme by the government. The purpose of red light cameras is to make streets safer, and if that results in some income, so be it. I’m more than happy to have these sociopathic drivers hit in the pocketbook, and the money can be used to make our streets safer, such as by installing more red light cameras. Red light tickets, with photos, are part of the documentation needed to revoke licenses and confiscate vehicles.
As promised, a follow-on to my post on the top bicycle collision intersections in Sacramento (Sac Vision Zero Top 5 Corridors and top intersections), here is the same sort of analysis for pedestrian collisions. I used a somewhat different data set, this time only killed and severe injury crashes (KSI), for the years 2009-2017. This mirrors the data the city used in the Vision Zero Top 5 Corridors document, and so is not directly comparable to the different criteria I used on the bicycle post.
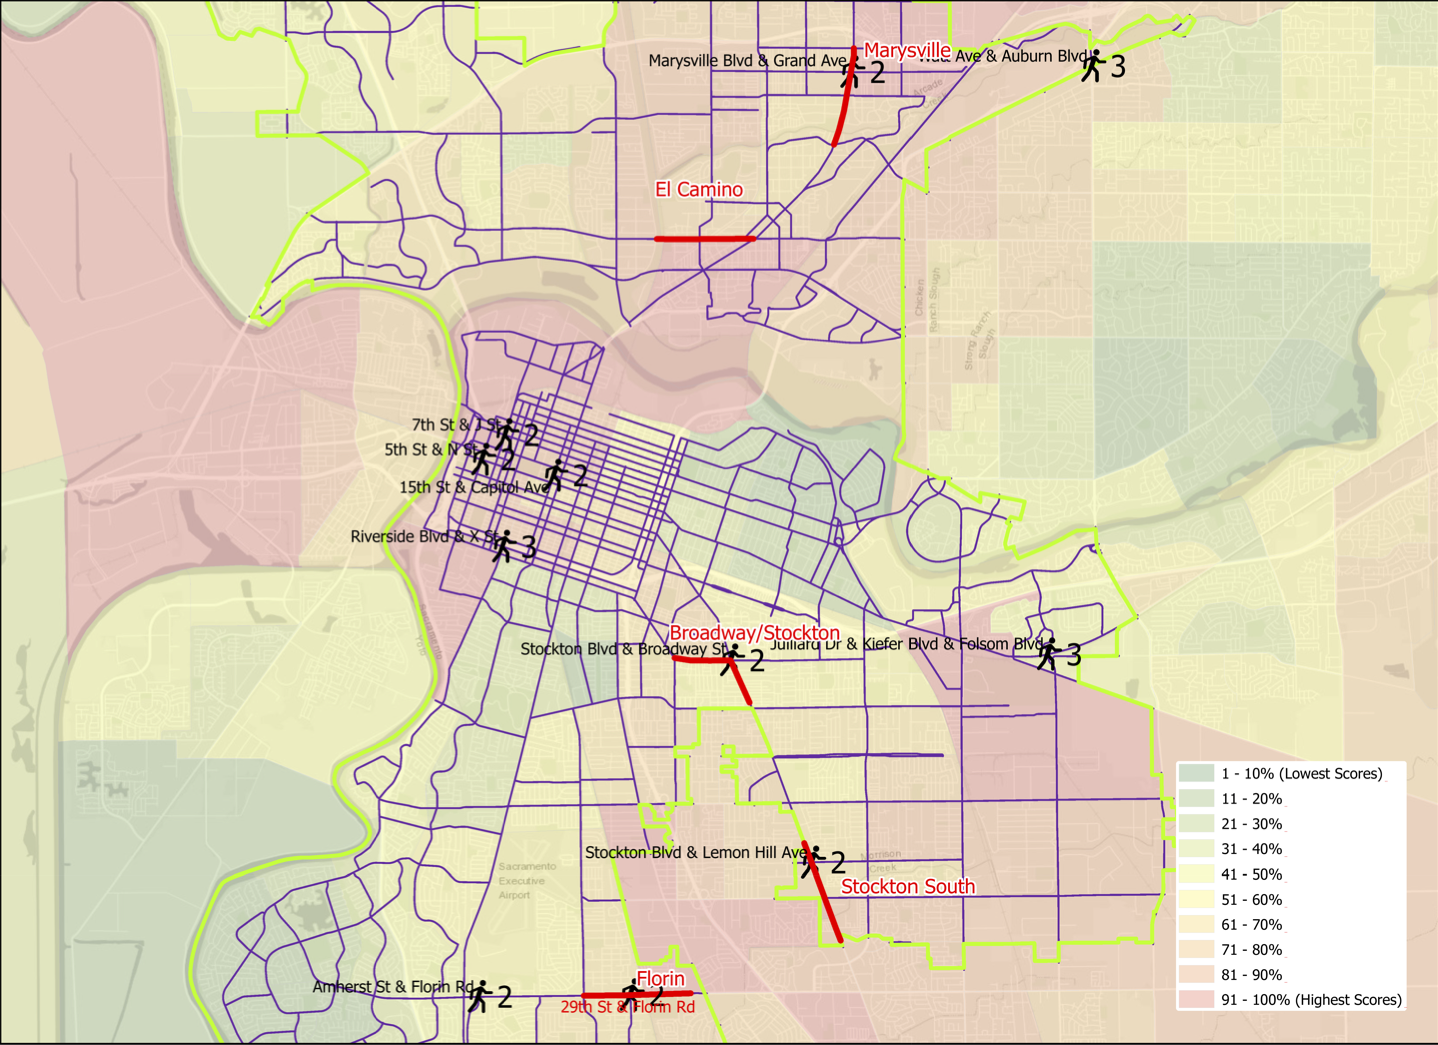
Pedestrian (walker) collisions are more dispersed that bicycle collisions, fewer occurring at intersections and more in between. Of the 408 collisions, 70 were at intersections, 17%, compared to 69% for bicycle collisions. Of these 408 collisions, twelve intersections stood out: Amherst St & Florin Rd, Marysville Blvd & Grand Ave, and Watt Ave & Auburn Blvd, each with three; and 15th St & Capitol Mall, 29th St & Florin Rd, 5th St & N St, 7th St & J St, Stockton Blvd & Broadway, Stockton Blvd & Lemon Hill Ave, Riverside Dr & X St, and Julliard Dr & Kiefer Blvd & Folsom Blvd, each with two. Of these 12 intersections, 4 are on Top Five corridors: Marysville Blvd & Grand Ave on the Marysville corridor, Stockton Blvd & Broadway on the Stockton-Broadway corridor, Stockton Blvd & Lemon Hill Ave on the South Stockton corridor, and 29th St & Florin Rd on the Florin corridor.
The map belows shows the city corridors and the twelve intersections, with the number of collisions and intersection name labeled. There is also a pdf available.
Sacramento pedestrian collision top intersections, with Vision Zero corridors
There is a better alignment between the five designated corridors and pedestrian collision intersections than was true for bicycle collisions.
I will point out that the Julliard Dr & Kiefer Blvd & Folsom Blvd intersection is the site of three pedestrian collisions and four bicycle collisions, which is higher than any other intersection in the city. It should really be a focus for the city.
Addition 2021-03-02: Someone asked how the pedestrian collision locations relate to disadvantaged communities. Below, a map with CalEnviroScreen 3 2018-06 (CES) layer, with red end being higher pollution, green being lower, and weighted with income. CES is not the only measure of disadvantage, but it is one commonly used.
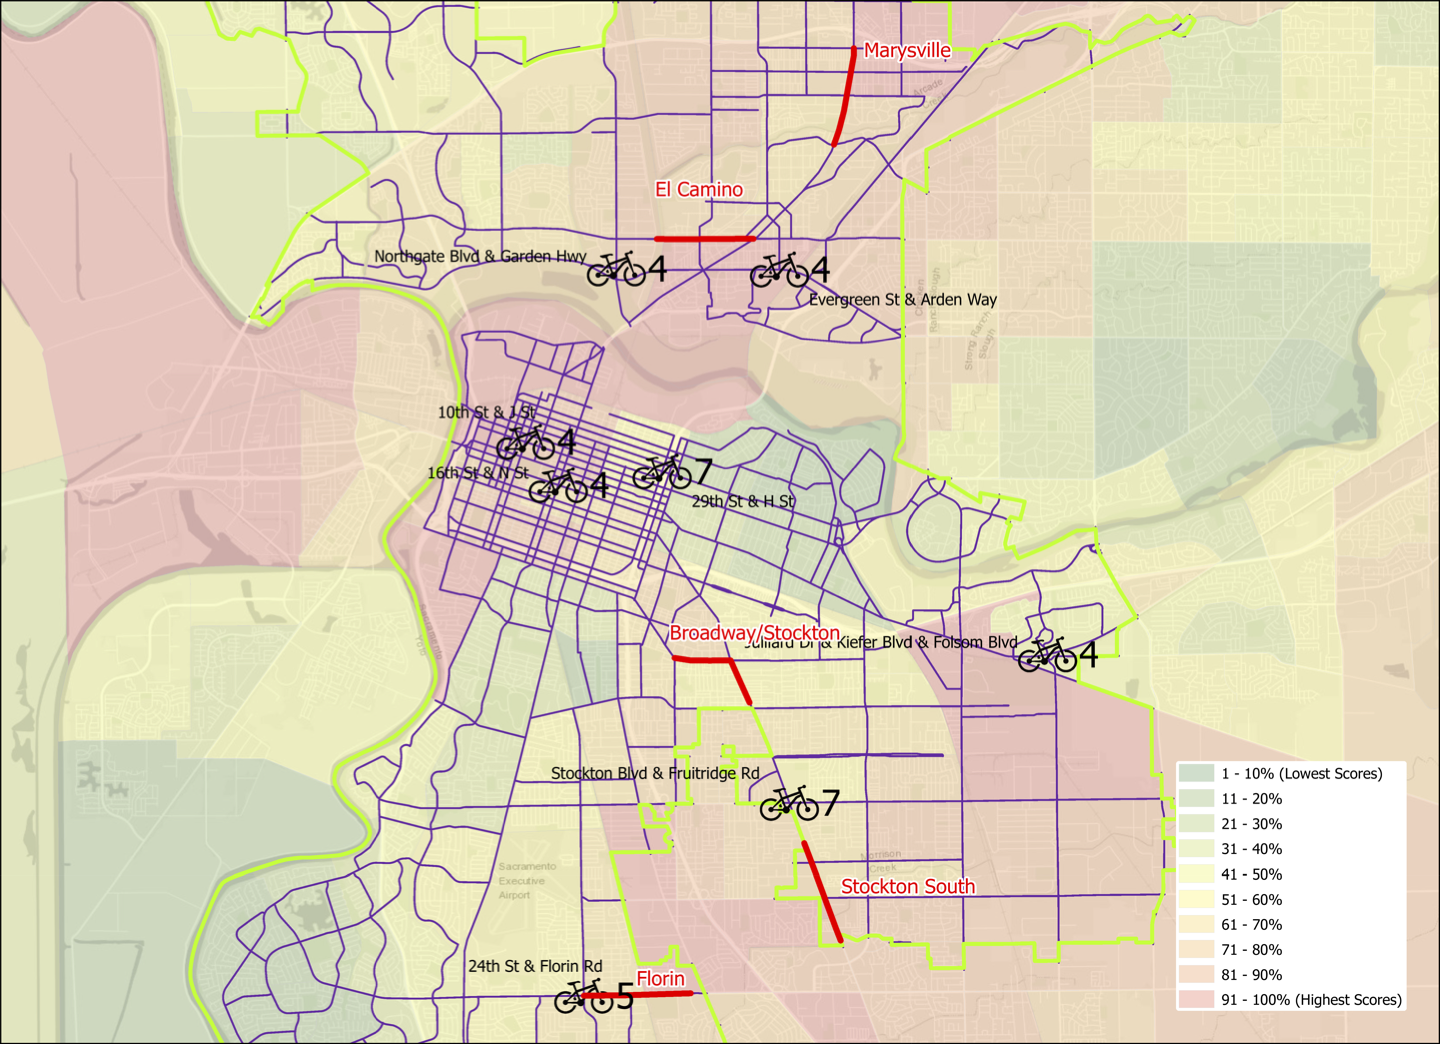
As promised in my previous post, Sac Vision Zero flaws, here is a limited analysis of high injury network intersections in Sacramento. I used bicycle crashes for 2014 through 2018 from the SWITRS crash database, and matched these to intersections of arterials and collectors in the city. It is known that most crashes occur at or near intersections, not in between. Of the 1112 crashes in this time period, 763 occurred at intersections, or 69% (for all crash types, the city said it is 78%). I selected eight intersections to highlight, which had 4, 5, or 7 crashes at the intersection or within 120 feet of the intersection, meaning on the approach or departure from the intersection. The other 590 intersections had 3, 2, 1, or no crashes. I did not analyze the crashes for fatality or serious injury, but that would be a useful.
The map below shows the Sacramento Vision Zero Top 5 Corridors, in red, and the top eight crash intersections with a bicycle symbol. The number to the right is crashes, and the location is labeled with cross streets. This is also available as a pdf.
Of the eight intersections, one is part of the Florin corridor, at 24th Street and Florin Road. The other seven are not.
I ask that the city revise its Vision Zero program to include high injury intersections. The number might be as many as 10, and selection should include the same equity criteria used to select the corridors. That means that the three central city locations might not be selected, or might be lower on the priority list, and that is good. The challenge of the Stockton Blvd & Fruitridge Road intersection is that it is on the city/county boundary, so complete treatment of the intersection would require some cooperation with the county. But with seven bicycle crashes in the time period, it is a very important intersection.
A strong advantage to giving high injury intersections recognition and attention is that they could receive near-term safety improvements that require only reallocation of roadway width and new paint. Full safety improvements probably would require redesign of the intersection.
Again, I fully support the city’s Vision Zero efforts, and want to see them be the best they can be. That means including high injury intersections.
Addition 2021-03-02: Someone asked how the bicycle collision locations relate to disadvantaged communities. Below, a map with CalEnviroScreen 3 2018-06 (CES) layer, with red end being higher pollution, green being lower, and weighted with income. CES is not the only measure of disadvantage, but it is one commonly used.