As promised in my previous post, Sac Vision Zero flaws, here is a limited analysis of high injury network intersections in Sacramento. I used bicycle crashes for 2014 through 2018 from the SWITRS crash database, and matched these to intersections of arterials and collectors in the city. It is known that most crashes occur at or near intersections, not in between. Of the 1112 crashes in this time period, 763 occurred at intersections, or 69% (for all crash types, the city said it is 78%). I selected eight intersections to highlight, which had 4, 5, or 7 crashes at the intersection or within 120 feet of the intersection, meaning on the approach or departure from the intersection. The other 590 intersections had 3, 2, 1, or no crashes. I did not analyze the crashes for fatality or serious injury, but that would be a useful.
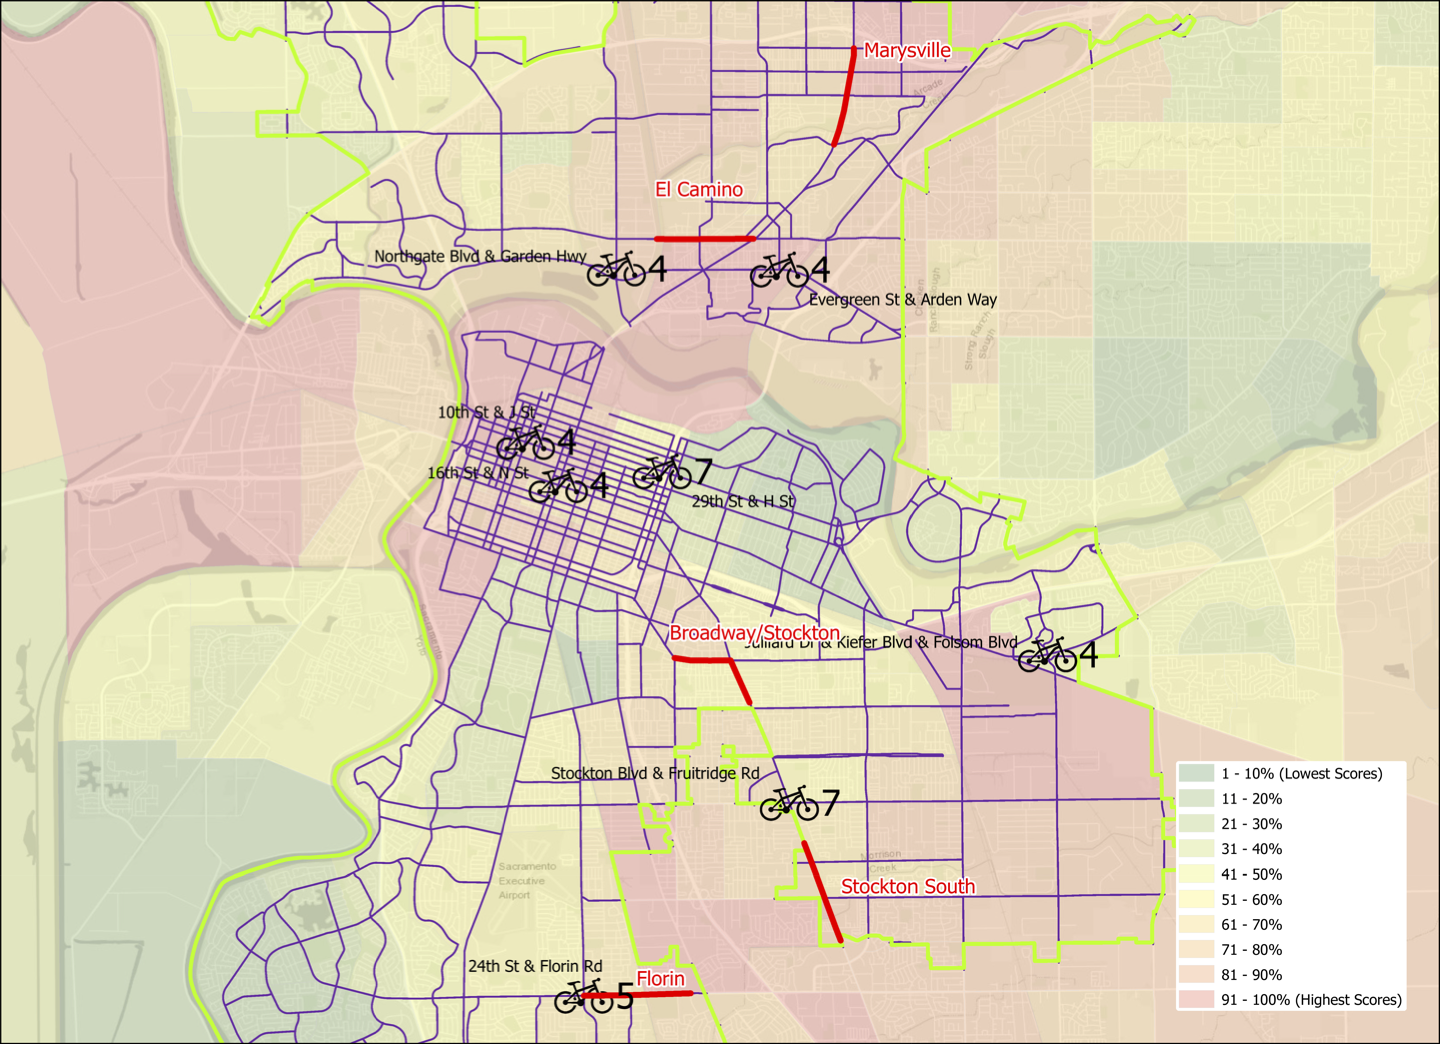
The map below shows the Sacramento Vision Zero Top 5 Corridors, in red, and the top eight crash intersections with a bicycle symbol. The number to the right is crashes, and the location is labeled with cross streets. This is also available as a pdf.

Of the eight intersections, one is part of the Florin corridor, at 24th Street and Florin Road. The other seven are not.
I ask that the city revise its Vision Zero program to include high injury intersections. The number might be as many as 10, and selection should include the same equity criteria used to select the corridors. That means that the three central city locations might not be selected, or might be lower on the priority list, and that is good. The challenge of the Stockton Blvd & Fruitridge Road intersection is that it is on the city/county boundary, so complete treatment of the intersection would require some cooperation with the county. But with seven bicycle crashes in the time period, it is a very important intersection.
A strong advantage to giving high injury intersections recognition and attention is that they could receive near-term safety improvements that require only reallocation of roadway width and new paint. Full safety improvements probably would require redesign of the intersection.
Again, I fully support the city’s Vision Zero efforts, and want to see them be the best they can be. That means including high injury intersections.
Addition 2021-03-02: Someone asked how the bicycle collision locations relate to disadvantaged communities. Below, a map with CalEnviroScreen 3 2018-06 (CES) layer, with red end being higher pollution, green being lower, and weighted with income. CES is not the only measure of disadvantage, but it is one commonly used.

[…] promised, a follow-on to my post on the top bicycle collision intersections in Sacramento (Sac Vision Zero Top 5 Corridors and top intersections), here is the same sort of analysis for pedestrian collisions. I used a somewhat different data […]
LikeLike
[…] show (Sac Vision Zero top intersections all modes, Sac Vision Zero top ped intersections, Sac Vision Zero Top 5 Corridors and top intersections), I thought it might be interesting to present the data in a different way. The two maps below show […]
LikeLike
[…] Sac Vision Zero top intersections all modes, Sac Vision Zero top ped intersections, Sac Vision Zero Top 5 Corridors and top intersections, and Sac Vision […]
LikeLike