Thinking about the intersections maps and what they show (Sac Vision Zero top intersections all modes, Sac Vision Zero top ped intersections, Sac Vision Zero Top 5 Corridors and top intersections), I thought it might be interesting to present the data in a different way. The two maps below show all of the top intersections identified in the all-modes, pedestrian, and bicycle data. They are divided into a north section and a south section so that the intersections and their labels are visible. The maps are available as pdfs (north, south).


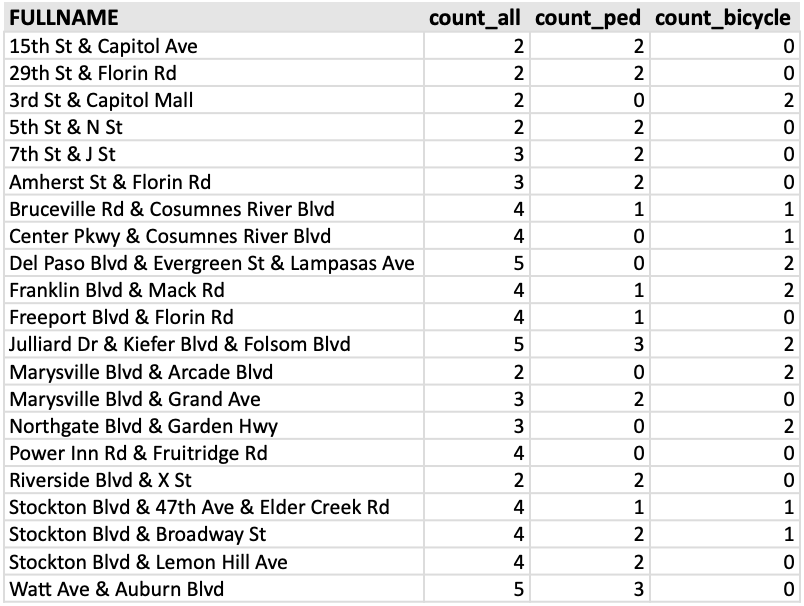
The intersection data is in the table below.
What’s next? I’ll take a closer look at some of these intersections. For people who follow traffic engineering, it will probably be immediately obvious why these intersections are dangerous. A detailed analysis requires looking at each collision record individually, which I don’t have time to do. The city did make use of incident reports, which contain more information than the data in SWITRS, in developing the Vision Zero Plan.

[…] written previously about Vision Zero high injury intersections in the City of Sacramento: Sac Vision Zero new intersections map, Sac Vision Zero top intersections all modes, Sac Vision Zero top ped intersections, Sac Vision […]
LikeLike