legend for intersections on maps belowSacramento top collision intersections, north sectionSacramento top collision intersections, south section
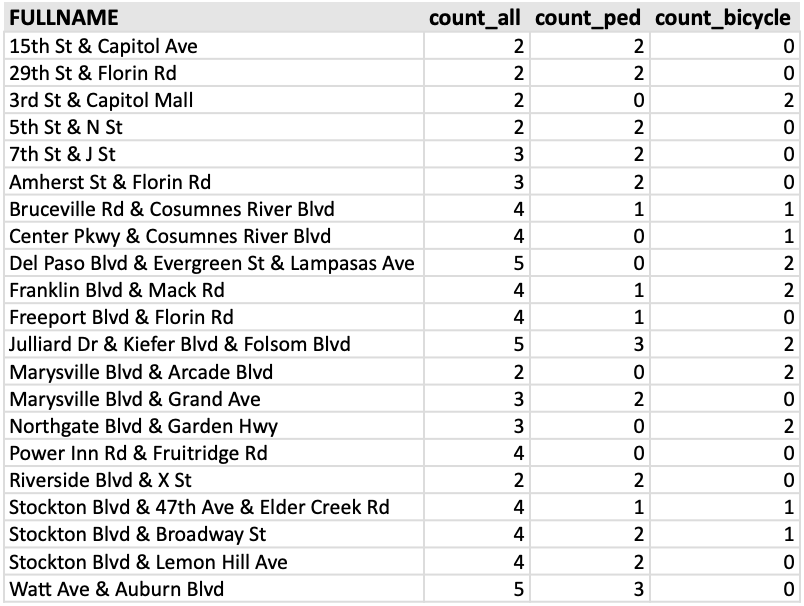
The intersection data is in the table below.
What’s next? I’ll take a closer look at some of these intersections. For people who follow traffic engineering, it will probably be immediately obvious why these intersections are dangerous. A detailed analysis requires looking at each collision record individually, which I don’t have time to do. The city did make use of incident reports, which contain more information than the data in SWITRS, in developing the Vision Zero Plan.
As promised, a follow-on to my post on the top bicycle collision intersections in Sacramento (Sac Vision Zero Top 5 Corridors and top intersections), here is the same sort of analysis for pedestrian collisions. I used a somewhat different data set, this time only killed and severe injury crashes (KSI), for the years 2009-2017. This mirrors the data the city used in the Vision Zero Top 5 Corridors document, and so is not directly comparable to the different criteria I used on the bicycle post.
Pedestrian (walker) collisions are more dispersed that bicycle collisions, fewer occurring at intersections and more in between. Of the 408 collisions, 70 were at intersections, 17%, compared to 69% for bicycle collisions. Of these 408 collisions, twelve intersections stood out: Amherst St & Florin Rd, Marysville Blvd & Grand Ave, and Watt Ave & Auburn Blvd, each with three; and 15th St & Capitol Mall, 29th St & Florin Rd, 5th St & N St, 7th St & J St, Stockton Blvd & Broadway, Stockton Blvd & Lemon Hill Ave, Riverside Dr & X St, and Julliard Dr & Kiefer Blvd & Folsom Blvd, each with two. Of these 12 intersections, 4 are on Top Five corridors: Marysville Blvd & Grand Ave on the Marysville corridor, Stockton Blvd & Broadway on the Stockton-Broadway corridor, Stockton Blvd & Lemon Hill Ave on the South Stockton corridor, and 29th St & Florin Rd on the Florin corridor.
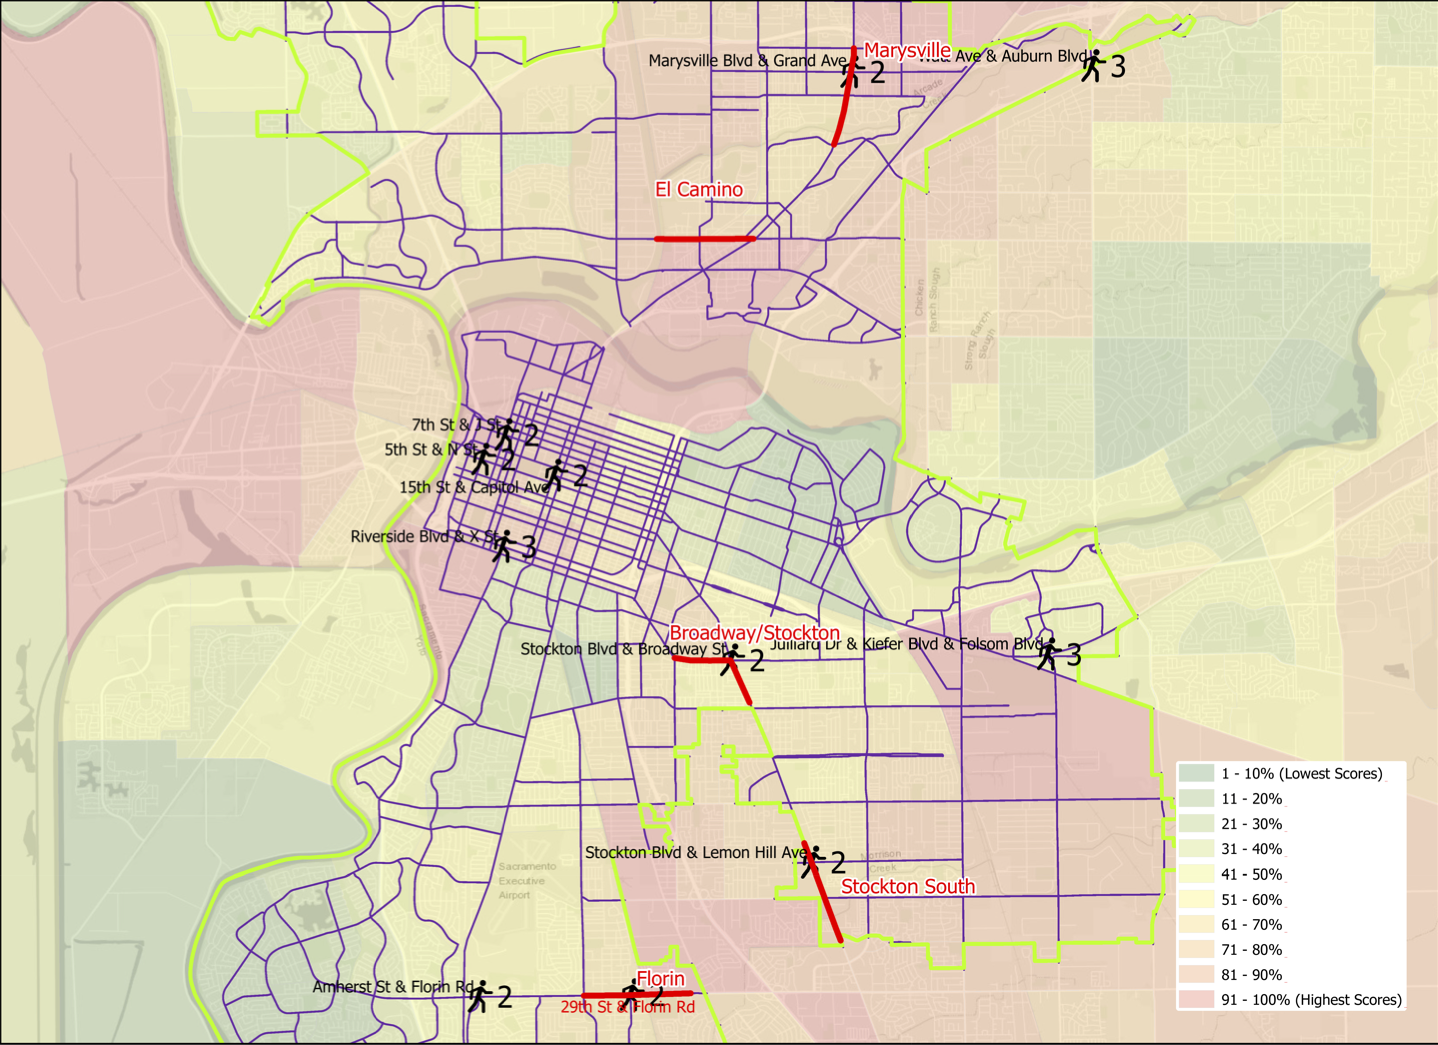
The map belows shows the city corridors and the twelve intersections, with the number of collisions and intersection name labeled. There is also a pdf available.
Sacramento pedestrian collision top intersections, with Vision Zero corridors
There is a better alignment between the five designated corridors and pedestrian collision intersections than was true for bicycle collisions.
I will point out that the Julliard Dr & Kiefer Blvd & Folsom Blvd intersection is the site of three pedestrian collisions and four bicycle collisions, which is higher than any other intersection in the city. It should really be a focus for the city.
Addition 2021-03-02: Someone asked how the pedestrian collision locations relate to disadvantaged communities. Below, a map with CalEnviroScreen 3 2018-06 (CES) layer, with red end being higher pollution, green being lower, and weighted with income. CES is not the only measure of disadvantage, but it is one commonly used.
I often wonder if governments really focus on the issues rather than responding to incidents. In the case of pedestrians and the City of Sacramento, is the city really placing its attention, and its dollars, where they need to be to enhance the safety of pedestrians? I’ve created some maps to show where the problems lie (see note at bottom about data sources and how these were created).
The collisions mapped are:
Date: 01-01-2004 to 12-31-2012
Location: City of Sacramento only (no, I can’t explain why some are outside the city)
The first map, a point map of the entire city, shows:
the greatest density of collisions is in downtown/midtown, but there are certainly plenty in other areas
almost all collisions happen at intersections, not mid-block
almost all collisions are associated with major streets, called arterials and collectors, which are wide and high speed, intended to move motor vehicle traffic at speed rather than provide for multi-modal transportation
pedestrian collisions, killed or severe injury, point map