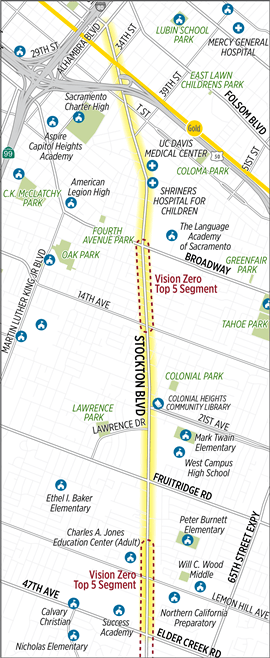
This is a follow-on the the Stockton Blvd Corridor Study post.
Trees
Following the online virtual open house, I realized I could not picture the situation on some segments of Stockton. Though I’ve traveled Stockton many times, I had not in a while, so I went back. I had commented during the open house, as well as after, that I didn’t think the cross-sections presented gave enough information on or weight to trees, so that was part of my agenda, to see the tree situation better. The day I went, last Sunday, was one of the cooler days in a while, high of 80 degrees Fahrenheit, but on the street the lack of shade and heat was noticeable. Add 20 degrees, and it would be intolerable for walking and unpleasant for bicycling.
The tree situation is not good. There are some sections with healthy trees, and some places where trees on commercial properties are healthy and shade the sidewalks, but on the whole, trees are lacking. The first photo below, taken looking south, to the south of Broadway, shows a long section with no trees at all, no buffer, no shade. The sidewalk is wide enough, but who would want to walk here?

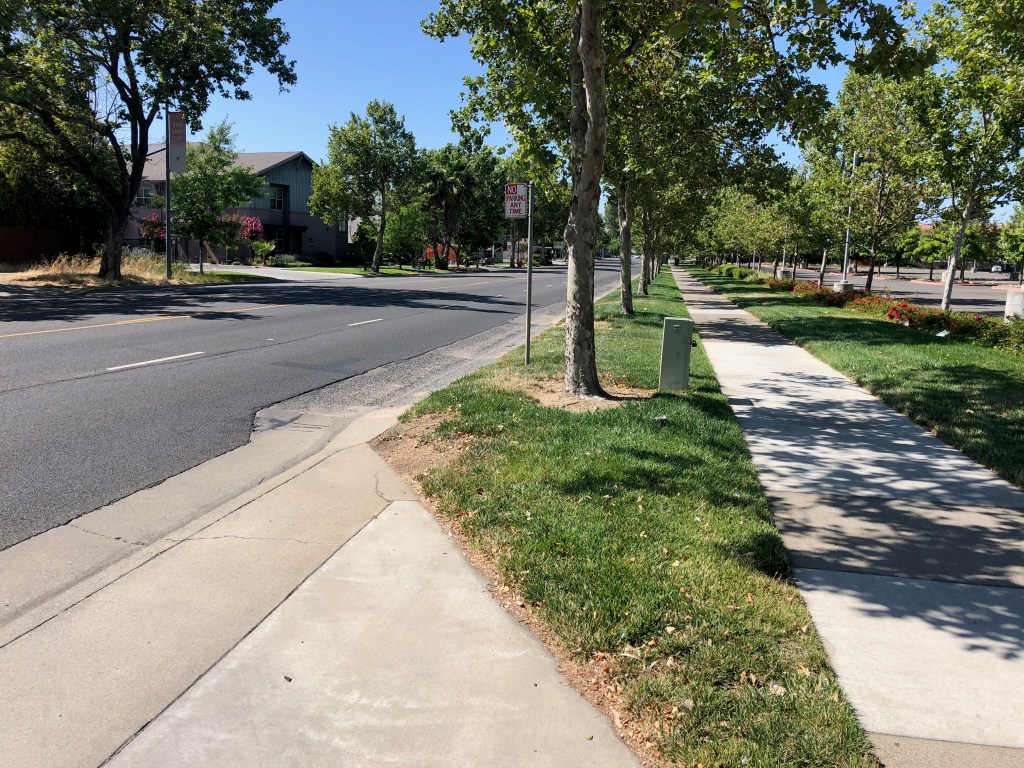
The next photo is of the section adjacent to UC Davis Medical Center where trees are present in a slightly too narrow buffer. The trees are relatively young, but when mature, will provide necessary shade and probably also crowd the buffer.
The next photo is of a very narrow strip where trees were present but were all cut down, and the following photo, a Google streetview capture of the trees. The trees were obviously planted in a strip far too narrow for them, and some of them were unhealthy as a result, so I’m not presenting this as a model, but as a warning that commercial properties cannot be relied upon to provide trees. Even the small trees in this narrow strip provided some shade and feeling of place to the street. In addition to this instance, there are many commercial properties and some residential properties along Stockton where the trees are dying, dead, or have been removed. And conversely, some where the trees on commercial properties are in good condition, so thank you to these properties. Trees, if they are to serve as a long-term amenity, as I believe they should, must be provided in the public right of way and maintained by the city.


A small archive of photos from Stockton Blvd are available in the Flickr album at the end of this post, and those who live along or do business along can provide more detail.
So what is the solution? The first part of the solution is that the city must modify its cross-section renderings and pages so that it highlights the tree situation. Will there be a sidewalk buffer? How wide? What numbers and kinds of trees? To what degree will the project rely on trees on private property, versus trees in the public right-of-way? I find the options presented as unacceptable because they don’t really address this issue. On a few of the pages, trees are mentioned, but never in enough detail.
I would propose for community along Stockton Blvd that there should be continuous sidewalk buffers planted with trees, all the way from Alhambra to 47th Ave/Elder Creek Rd. Where buffers are present with trees, great, make sure they are preserved and cared for. Where buffers are present but the trees are absent or unhealthy, plant new trees and care for them. Where there are no buffers, create them, and plant trees and care for them. Where there is a healthy tree line on private property, this can serve for now, but the buffer should still be provided for the protection of walkers and as a bulwark against possible abandonment of the private trees. I envision Stockton Blvd being a tree-lined community asset, where walking is a pleasure and traffic speeds and volumes are low.
For new buffers, the minimum width of the buffer should be eight feet, as anything narrower does not allow for full development of the trees, and leads to excessive root heaving of the sidewalk. The heaving is to some degree an inevitable consequence of having trees, but wider buffers and correct watering regimes reduce the problem considerably. Where the existing buffers are at least six feet and the trees are healthy, the buffer can be widened or left as is, depending on the situation. Where the buffer is narrower than six feet, the buffer must be expanded.
Where commercial businesses are present and buildings meet the sidewalk, the trees should still be present, but the spacing and species can be adjusted in consultation with the property or business owners so that they don’t block off visibility of local businesses. In most cases the buffer would be paved, with tree wells for the trees, and street furniture or other amenities in the buffer, but the buffer would still be a minimum of eight feet.
Intersections
Another issues that the city diagrams and information do not address is intersections and crossings. The existing conditions report acknowledges that there are long distances between safe crossings on the south end, but doesn’t provide much detail about intersections.
The intersections as they exist actively discourage pedestrian activity. The midblock crossings, of which there are a few, do not have any additional protection. At a minimum, these locations need user-activated RRFBs (Rectangular Rapid Flashing Beacons). At many of the signalized intersections with minor streets, there is a pedestrian prohibition on either the north or south leg. These prohibitions exist solely to speed the signal cycle and encourage traffic flow; they do not exist for safety reasons. They must be removed. The photos below shows just one of the many such prohibitions. A person walking on the south side of Jansen, wanting to go south on Stockton, would have to use two crosswalks, waiting for the signal, and then walk through an overly wide commercial driveway. There is no reason for this.

At the major intersections, where crosswalks are present on all legs, the crossing distances are long. Though not as bad as many other locations in Sacramento, intersections are often flared out to add turn lanes, both left and, often, right turn lanes. This increases crossing distance. This issue can be solved in two ways: removing the unnecessary turn lanes, or adding pedestrian refuge islands in the middle, so that slower walkers can make the crossing in two stages. The medians must be six feet wide, to meet standards, and must have a pedestrian button so that people don’t become stranded. (Note: I’m not in favor of pedestrian buttons at all, except when they: 1) trigger audible information, or 2) lengthen the crossing time; however, this is one situation in which they make sense)
The project information does not really address intersections at all. City staff said that these details would be worked out later, but I find this unacceptable. Intersection design must be part of the options presented. Intersections are where most conflicts occur between pedestrians and vehicle drivers, and bicyclists and drivers as well, so they are a critical element of any effort to improve Stockton.
Driveways
Some of the sections of Stockton are littered with driveways. Each commercial property has one to several. Part of improving Stockton must be to reduce the number of driveways. Each commercial property should have one driveway, or less. One of (the only) advantages of the parking moats that front the street (what I mean by parking moat is that the commercial buildings are set back away from the street, and parking lots face the street; these parking moats contribute significantly to the feeling of Stockton Blvd being a car-dominated place). In several cases, these parking moats can be combined for several properties in order to reduce the frequency of driveways. The issue with driveways is that they not only make a place feel busy and unwelcoming to walkers and bicyclists, but they are safety hazards for walkers and bicyclists very nearly as bad as the hazard of an intersection.

Built Form
There is a section of ‘old’ Stockton Blvd where the buildings come to the sidewalk, and parking, if any is to the side or back. This traditional pattern (traditional before suburban sprawl) is the best built environment, the one that feels most welcoming to people outside cars. It increases customers, it makes the street feel smaller and the sidewalk feel larger.
The ‘new’ sections of Stockton Blvd where buildings are set back behind a moat of parking have exactly the opposite effect, producing an environment that feels unwelcoming to walkers, makes the sidewalk feel like a part of the street rather than a part of the neighborhood. This built form is a widely recognized mistake, but the correction will take many, many years as these commercial properties evolve. But what can happen, now, is that all new commercial buildings can be required to front the sidewalk. There are a lot of empty or abandoned parcels on Stockton, which everyone hopes will see new development. That development should be the traditional pattern that gives the street a neighborhood feel rather than a traffic sewer feel.

Speed Limits
Another issue that the study pays scant attention to is speed limits. Whether or not the street design option work depends on design speed and posted speed. The default assumption in transportation planning is that speed limits cannot be lowered, due to California ‘law’. First, it is not a law, it is case law, established by judges, not the legislature, that says traffic tickets won’t be enforced unless speed limits are set to the level at which only 15% of drivers exceed. This will of course be changed, but the process is long, with powerful opponents, most specifically CHP whose lip service to safety is legend. But more important to this study is that streets that are reconfigured, with a change to lane width or number of lanes or mix of modes, can be set to any speed limit the city wishes. The road is new, and the past speed limit doesn’t apply.
So, in accordance with my desire to see a tree-lined neighborhood boulevard, I think that the speed limit for this entire length should be 30 mph. And of course the street must be designed to enforce that posted speed limit.
Highway 50 Interchange
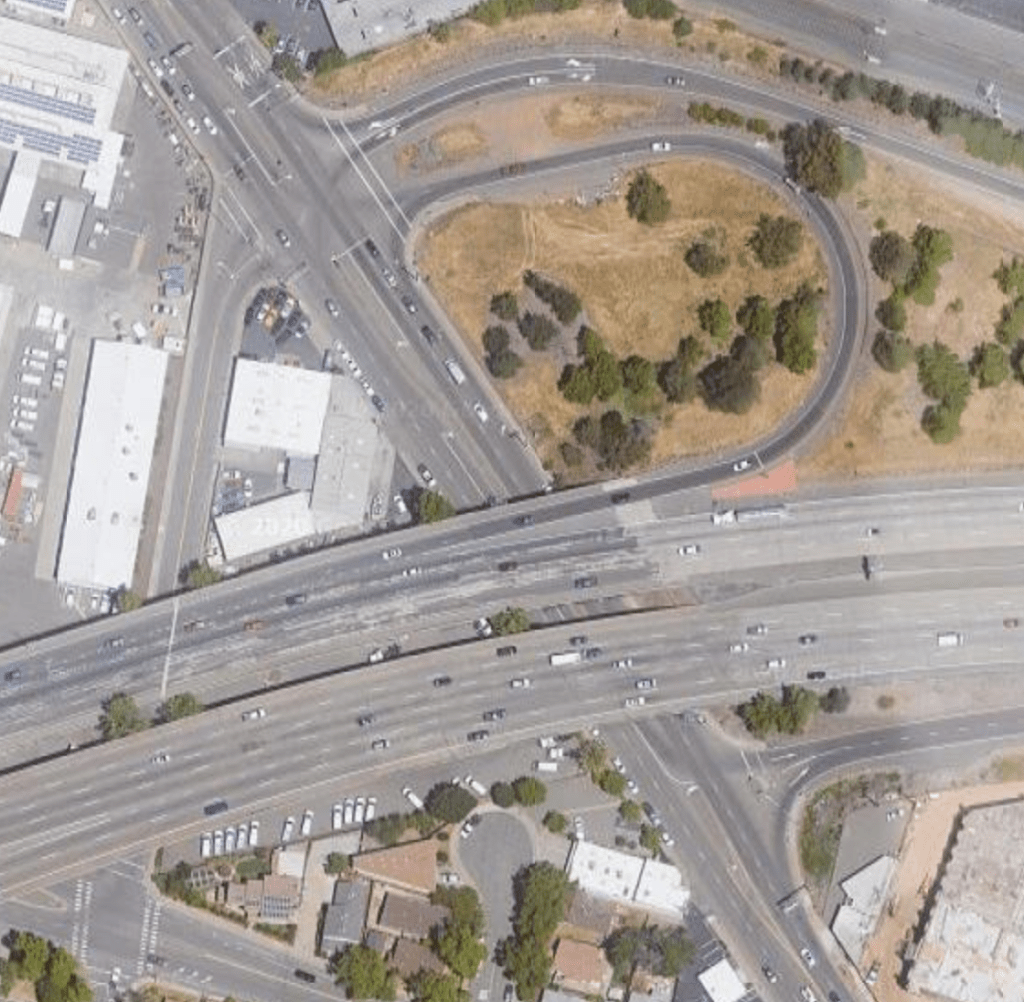
The Hwy 50 and Stockton Blvd interchange is problematic for both walkers and bicyclists. There are no bike lanes through this section, at all, and walkers on the east side of Stockton face long crossing distances in a design that strongly favors high speed motor vehicle drivers. In the photo below, look at the long crossing distance on the north side of the freeway, of the exit and entrance ramps. It’s about 120 feet, with no protection from drivers, at all. I have both used and observed this crosswalk, and can confirm that very few drivers yield to walkers in the crosswalk. It is a guaranteed death trap for walkers.
The roadway striping does not delineate areas for motor vehicles and bicyclists, nor does it indicate where riders or drivers should be merging to reach their destination. It is just a wide-open area, and as with all wide-open areas, drivers will assume they have complete right-of-way. You can see by the tire tracks that the turns on and off the freeways are being taken at high speed.
This interchange must be completely reconfigured for the safety of walkers and bicyclists, and drivers for that matter. The entry and exit ramps must connect with the street at 90 degree angles, requiring drivers to make low speed turns. Bicycle lanes with green conflict markings must be installed throughout the interchange. Sidewalks must be improved and crossing distances shortened to no more than 22 feet.
It is disappointing that such a critical safety hazard was not addressed in the study.
Mode Share
The study, online survey, and open house never address the key issue for the entire corridor, which is: what should be the priority of travel modes in design of the street? Some of the options imply a higher priority for some modes than others, but the critical question is never asked of the public. I had said in my previous post that my priorities would be transit first, then walking, then bicycling, then private motor vehicle travel. However, having spent more time looking at and thinking about the corridor, I’m going to change that. The priorities should be walking first, strongly supported by the tree-lined boulevard configuration I’ve outlined and justified, then transit, then bicycling, then private motor vehicles.
What is is important here, though, it not my preference, but that the public, and in particular the residents and customers along the corridor were never asked this question.
What Now?
I’ve laid out what I consider some major flaws in the study. I am not against the particular options that were presented, and from that limited perspective, the study has done a good job. But the number of things NOT considered is glaring. I know the city hopes to address these issues later, but I don’t find later to be acceptable. The public needs a full set in information now, so that it can comment on the study from a perspective of understanding how the street will feel after the changes, not just design diagrams, but how each traveler will get along and across the corridor, and whether it supports their desires for mobility and livability.
I think the city should pause the study process and add in the elements not addressed, then go back out to key stakeholders, and re-do the engagement process including the survey and open house.
Photos on Flickr: https://www.flickr.com/photos/allisondan/albums/72157714923753216