2026-02-23: minor update to add Casa Flores Cafe
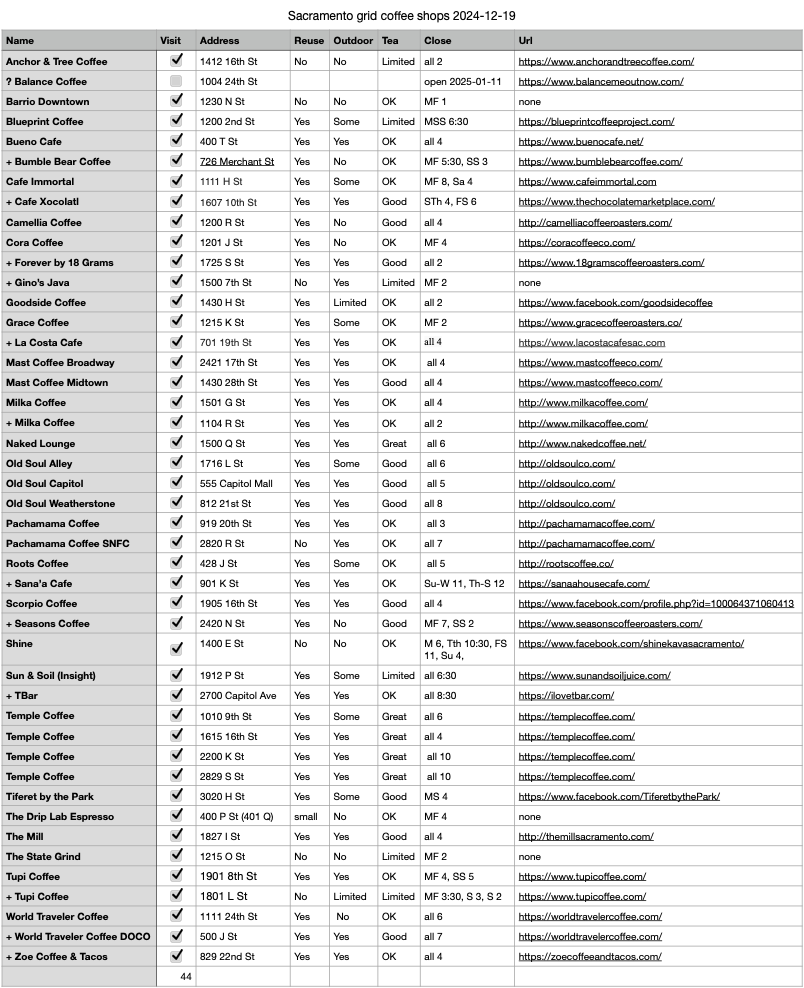
I first posted on coffee shops on the grid in April 2023, with an update in December 2024. Time for another update, as there are a number of new coffee shops, and a few have gone. The coffee shops marked with a plus (+) are new since the last update.
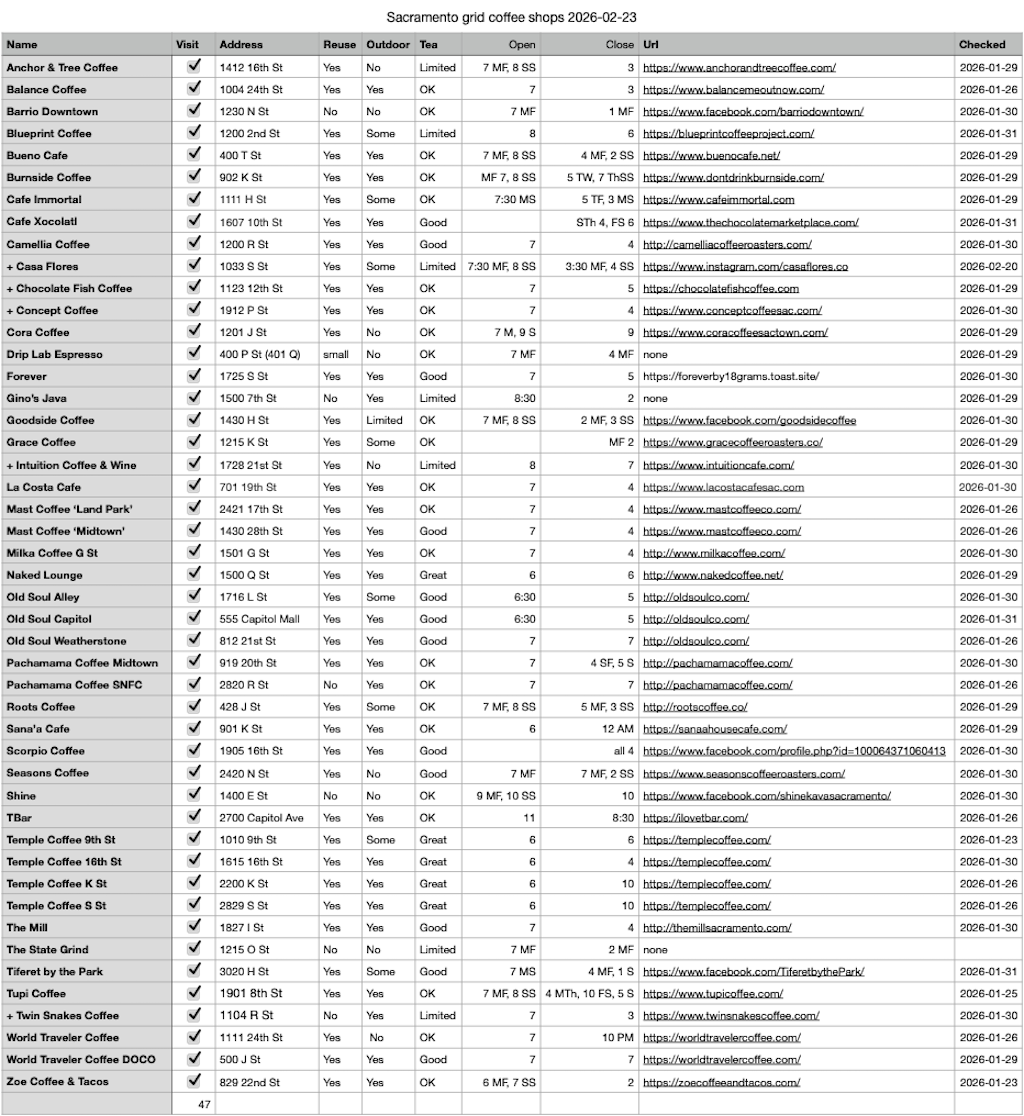
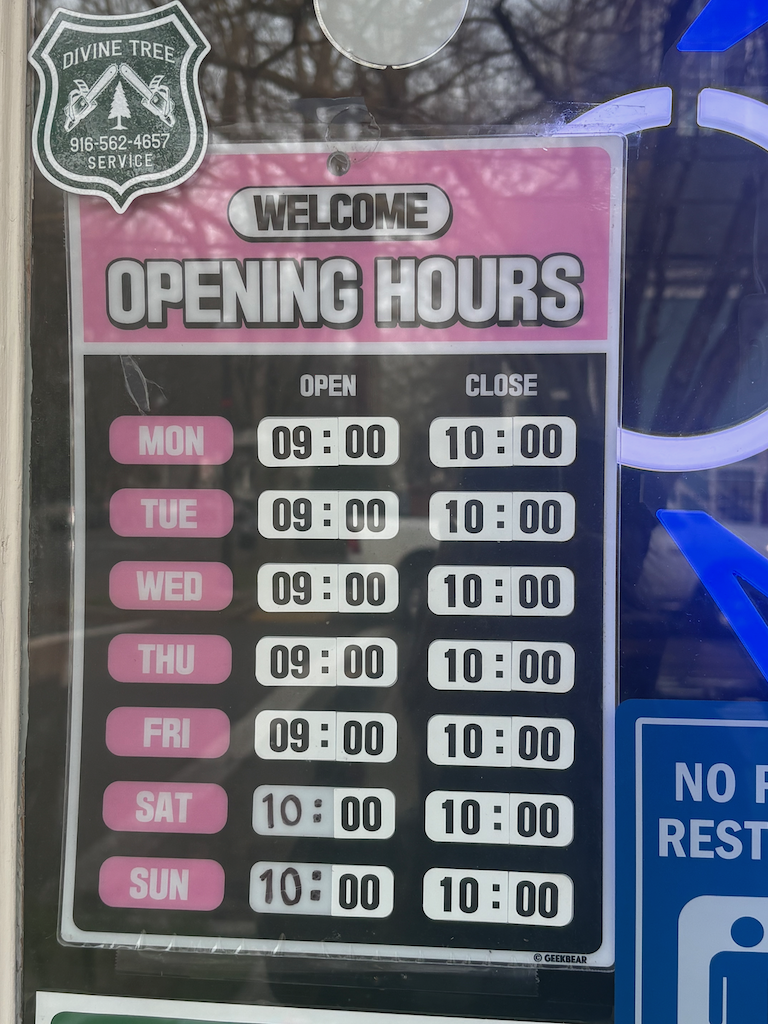
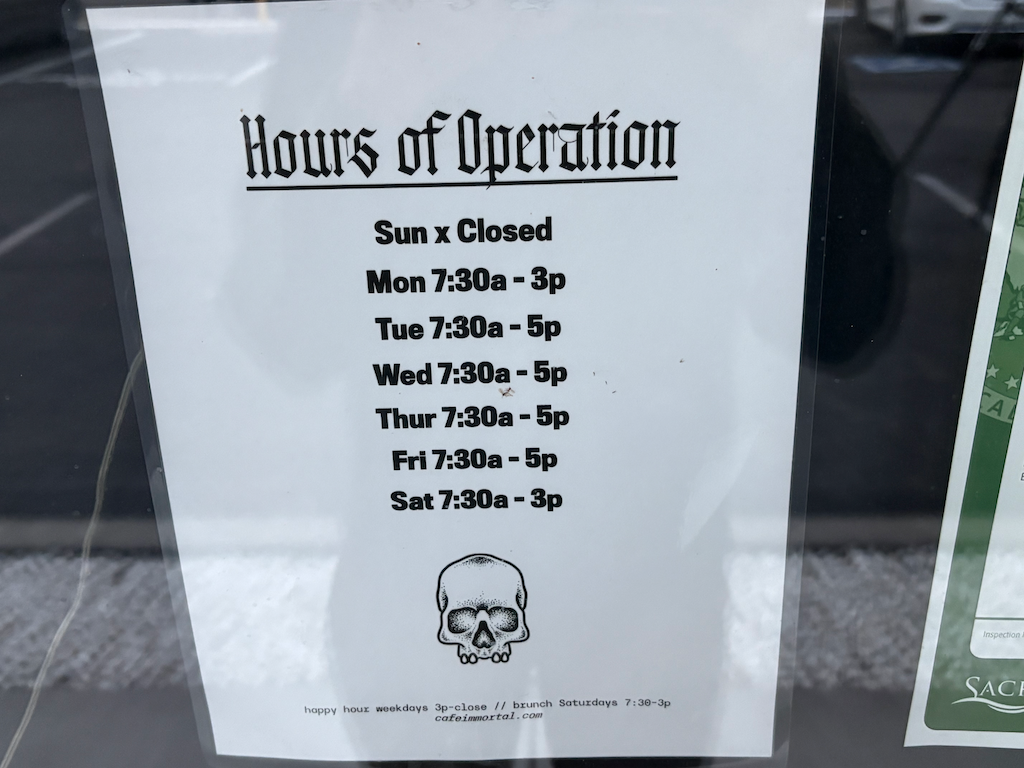
Though the links in the png above look clickable, they are not. You must use the xlsx or pdf versions for links. The columns are what interested me. Reuse means they offer reusable cups for tea and coffee service, outdoor means they offer outdoor seating, and tea indicates my take on the number and variety of teas offered. I have refined hours with open and close. It should be noted that some coffee shops do not post their hours, either on the websites or on the door, and hours often change, so take these hours with a grain of salt. The ‘checked’ column means that the business was checked for existence, but the details were not necessarily checked.
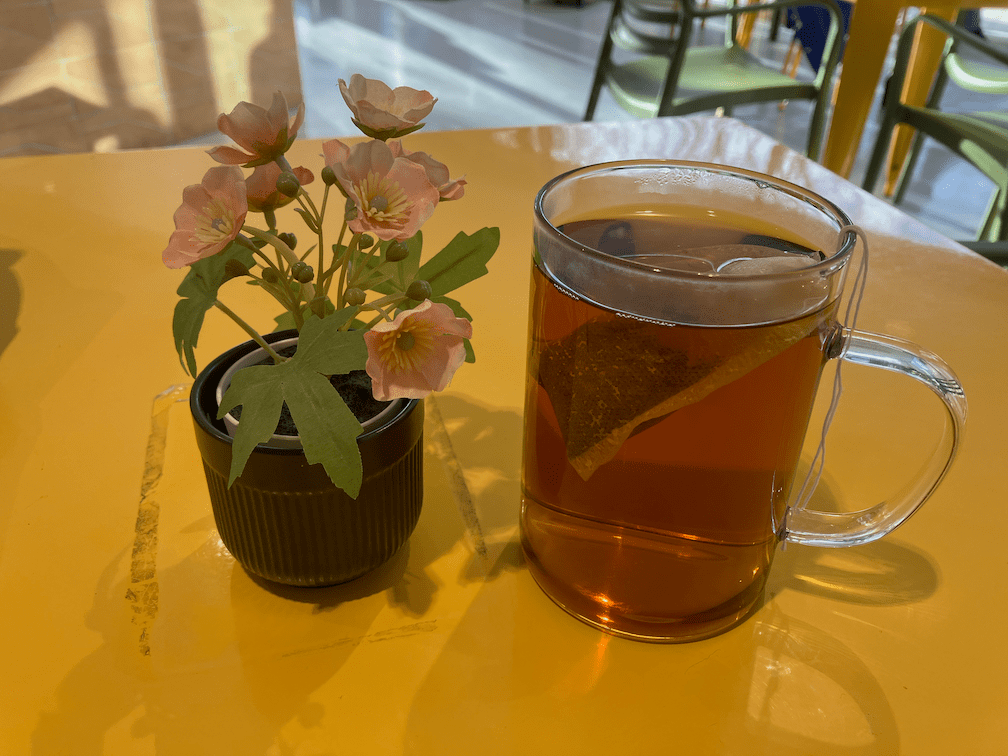
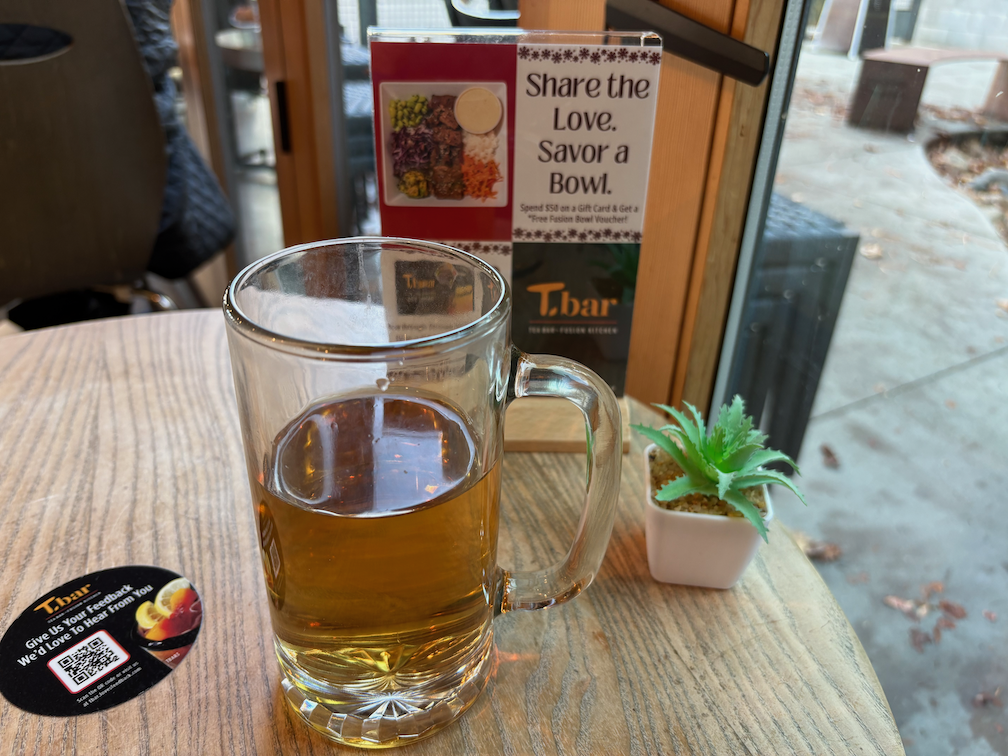
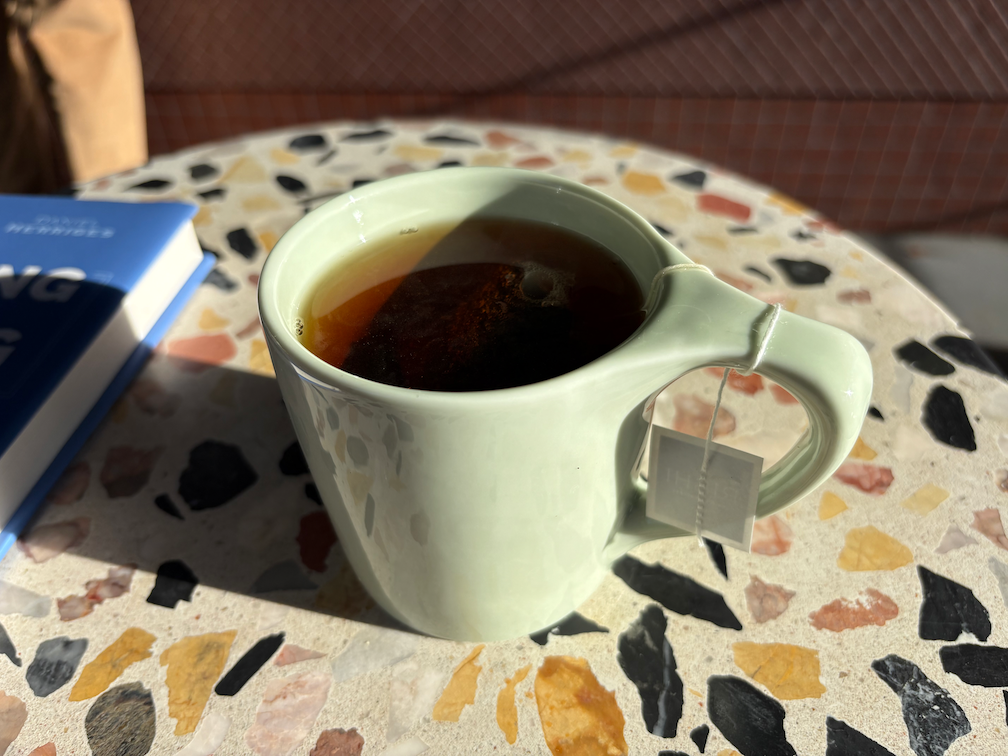
Disclaimer up front: I don’t drink and don’t even like coffee, but I do drink and love tea, and the majority of coffee shops offer tea as well, but most other businesses do not. So I can tell you absolutely nothing about the variety or quality of coffee at any of these shops.
I have long believed that the frequency of locally-owned coffee shops is a key indicator of livability and walkability. Though I’ve not done the calculations, I think this measure would be just as effective a ‘walk score’ as the WalkScore offered by Redfin, which uses a complicated and proprietary algorithm to determine walkability, measured as distance to amenities. Note that WalkScore does not assess the walking environment such as presence or condition of sidewalks, and safety of crossing streets.
I live in the Sacramento central city, the area bounded by the Sacramento River to the west, Broadway to the south, Alhambra Avenue to the east, and the railroad tracks to the north. I have focused my coffee shop visits on this area. Though there are certainly coffee shops throughout the urbanized county, the number of locally-owned coffee shops drops off rapidly outside the central city. In much of the suburbs, there are only chain coffee shops such as Starbucks and Peets. I do not list national chain coffee shops such as Starbucks, Peets, and Philz.
My new preferred coffee shops are Zoe Coffee and Tacos (yes, an unusual name, but their tacos and samosas are good), mostly for the friendliness of the manager and baristas, and Tupi Cafe, which is on my morning walks to Southside Park.
If you have a place to suggest, or updated information, please comment. There is a fuzzy line between places which are mostly coffee shops, and places that are mostly cafes, but also have coffee and tea. In fact Google Maps and Apple Maps makes this fuzzier by allowing businesses to show an icon on the map that reflects what was searched for, not the primary classification of business. I assume they pay for this.
If you also like to drink tea at home, as I do, I recommend Tea Cozy, 1021 R Street, next to Fox and Goose, with a very large and diverse offering of bulk and packaged teas. And in Davis, Mishka’s Cafe, 610 2nd Street, offers a selection of brewed tea unparalleled in the region, so far as I know.
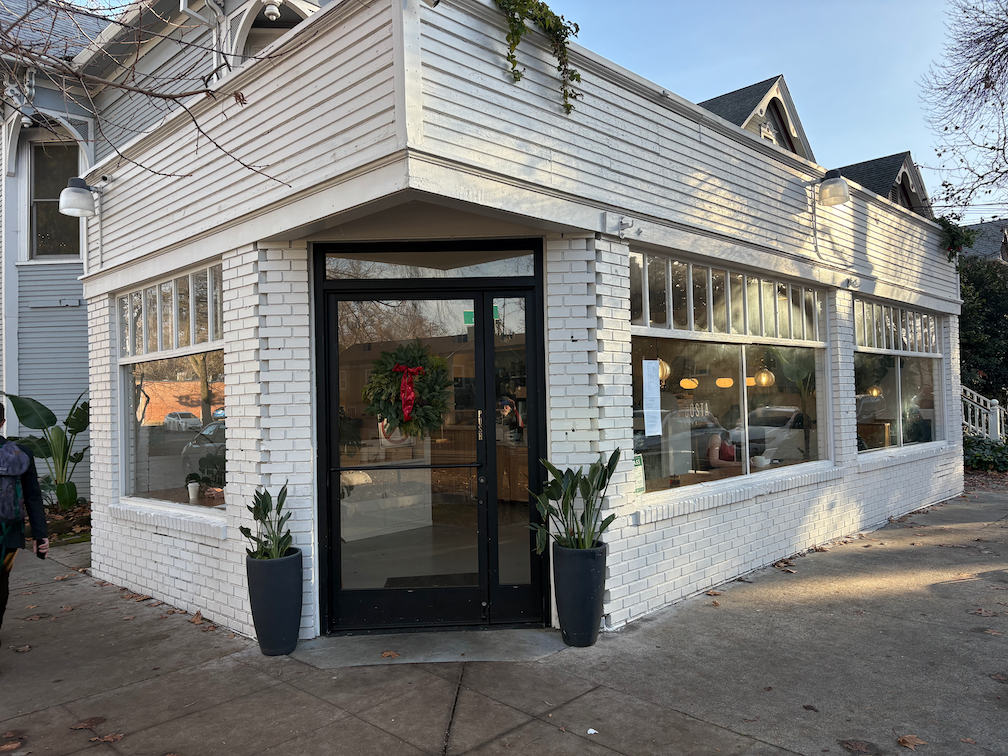
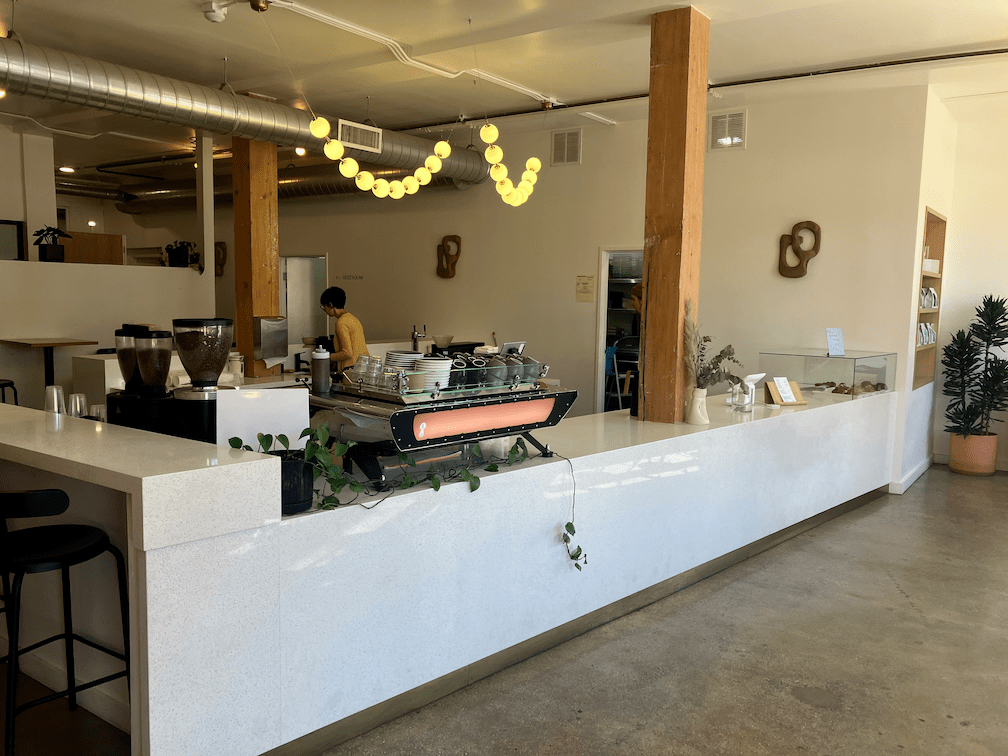
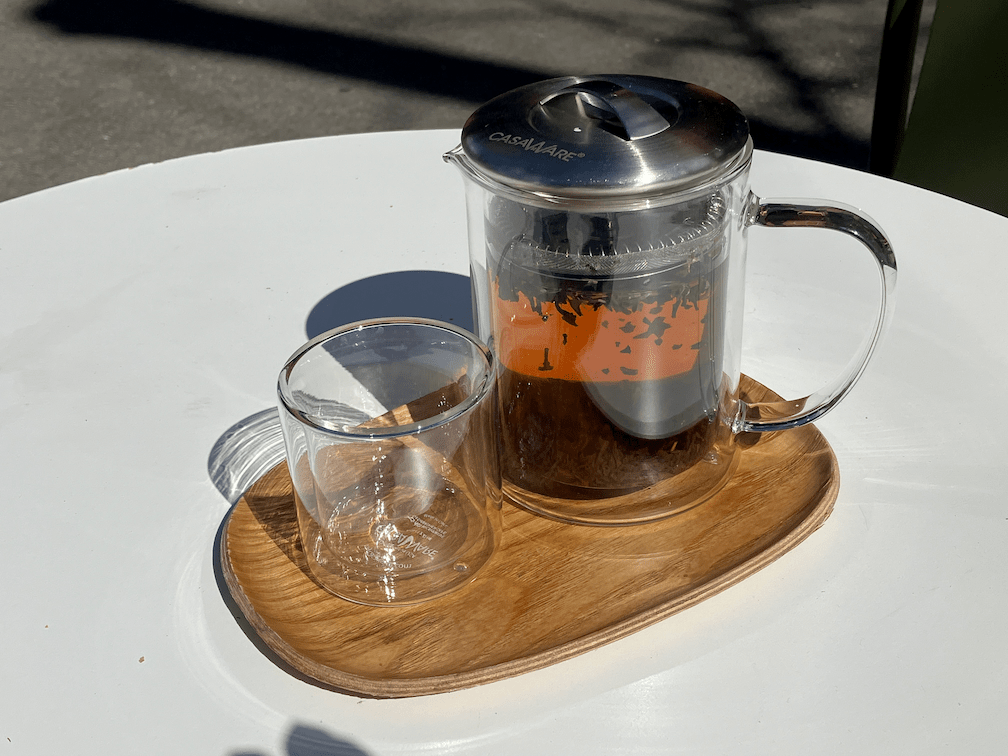
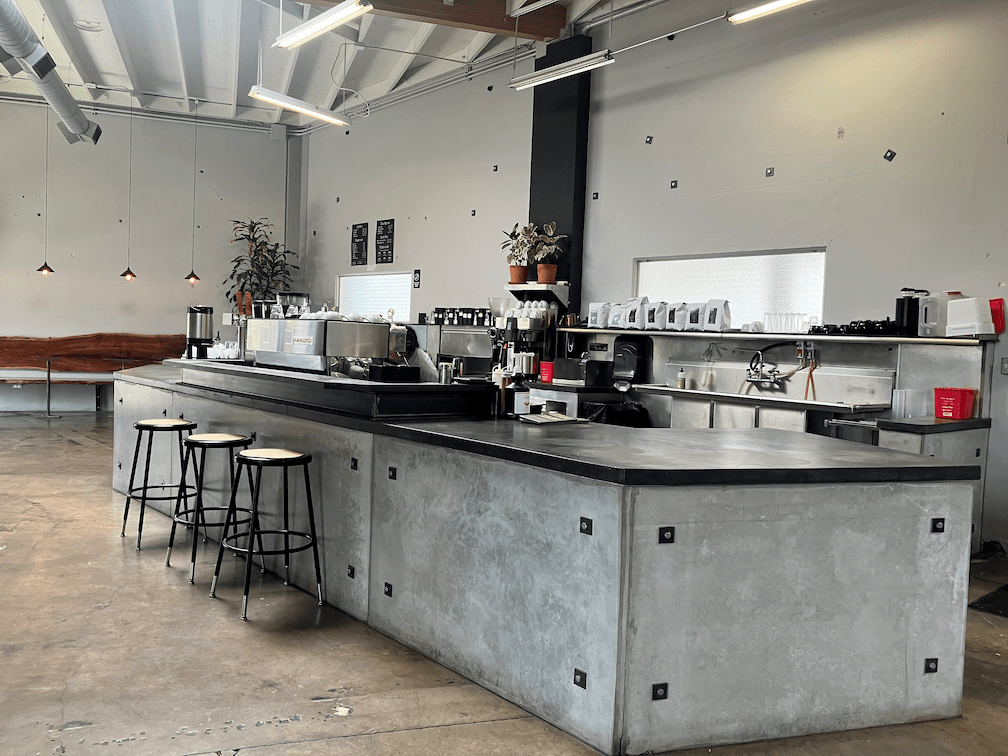
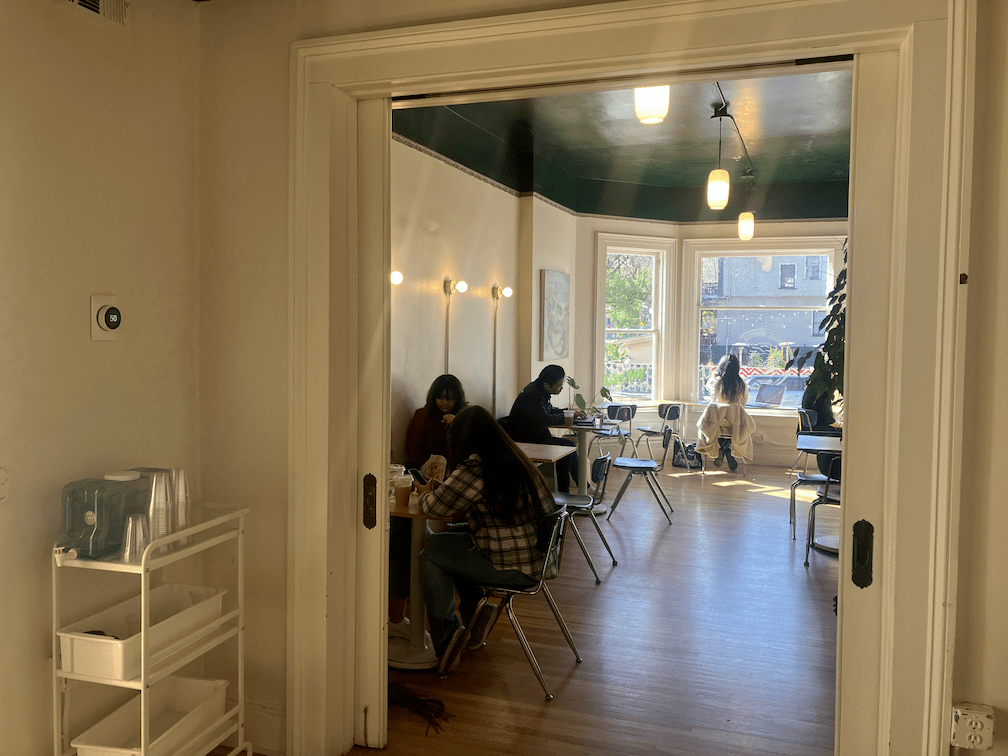
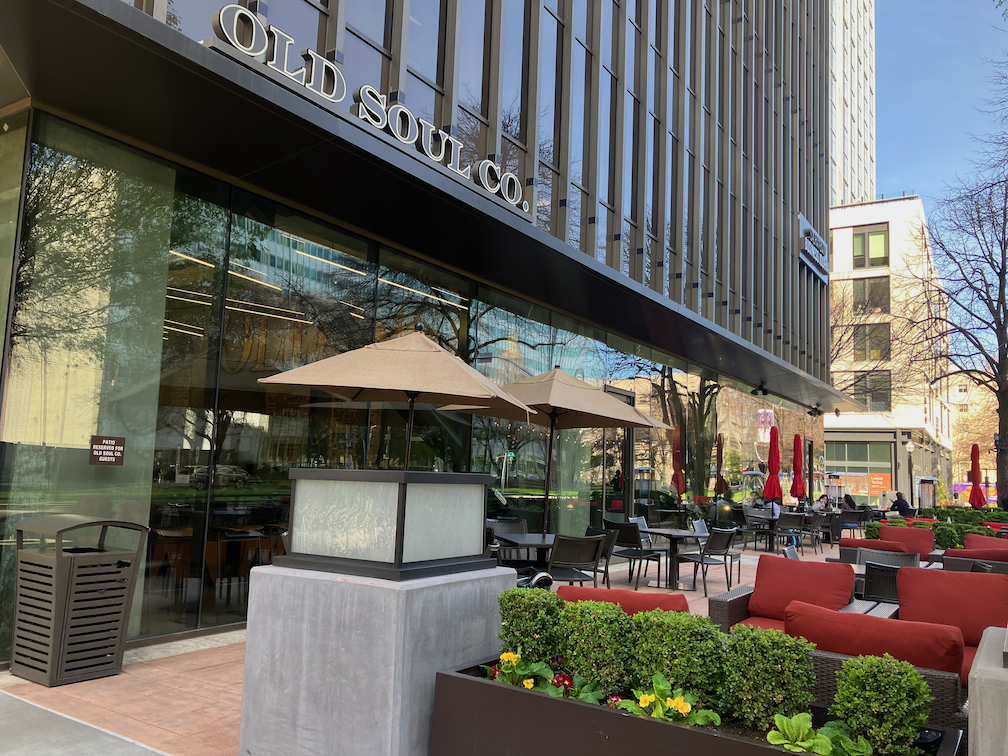
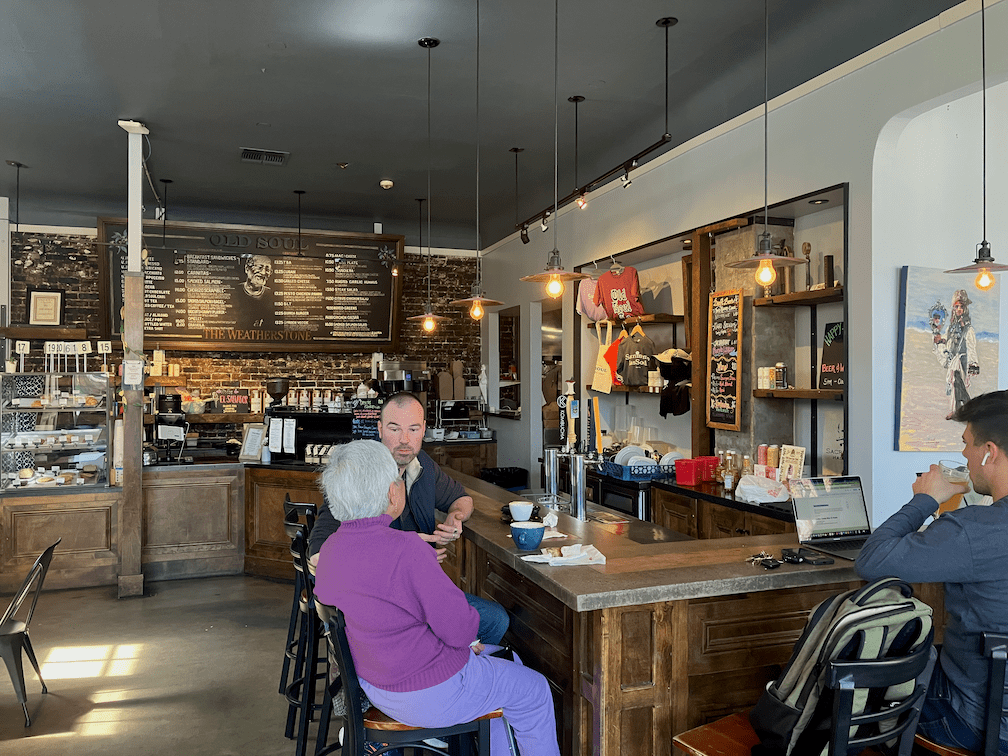
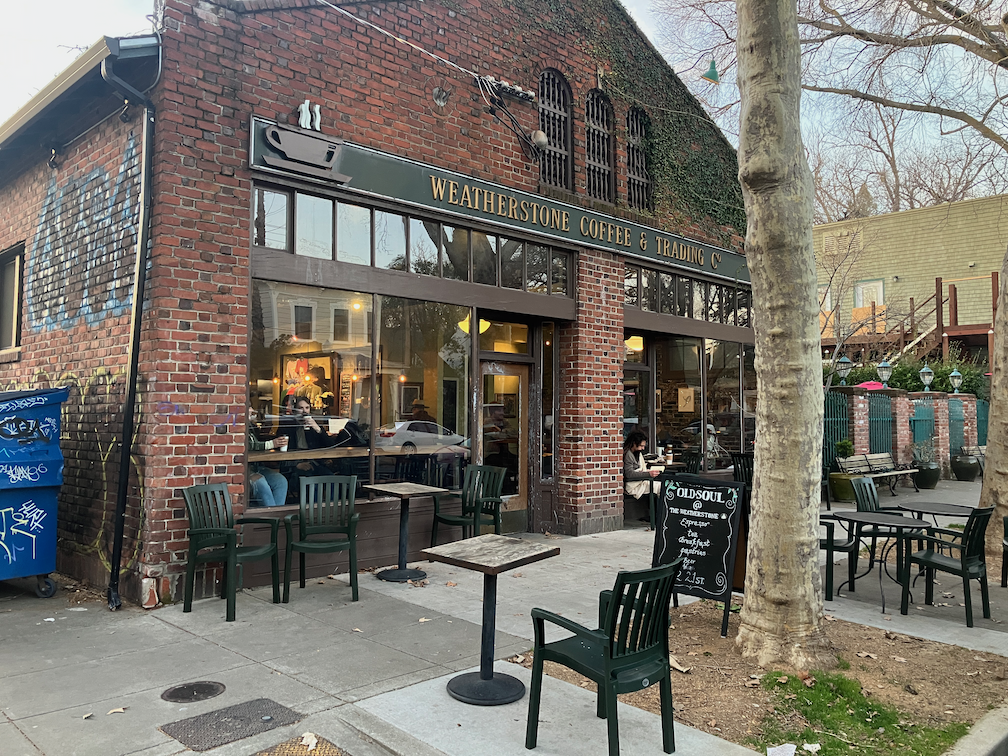
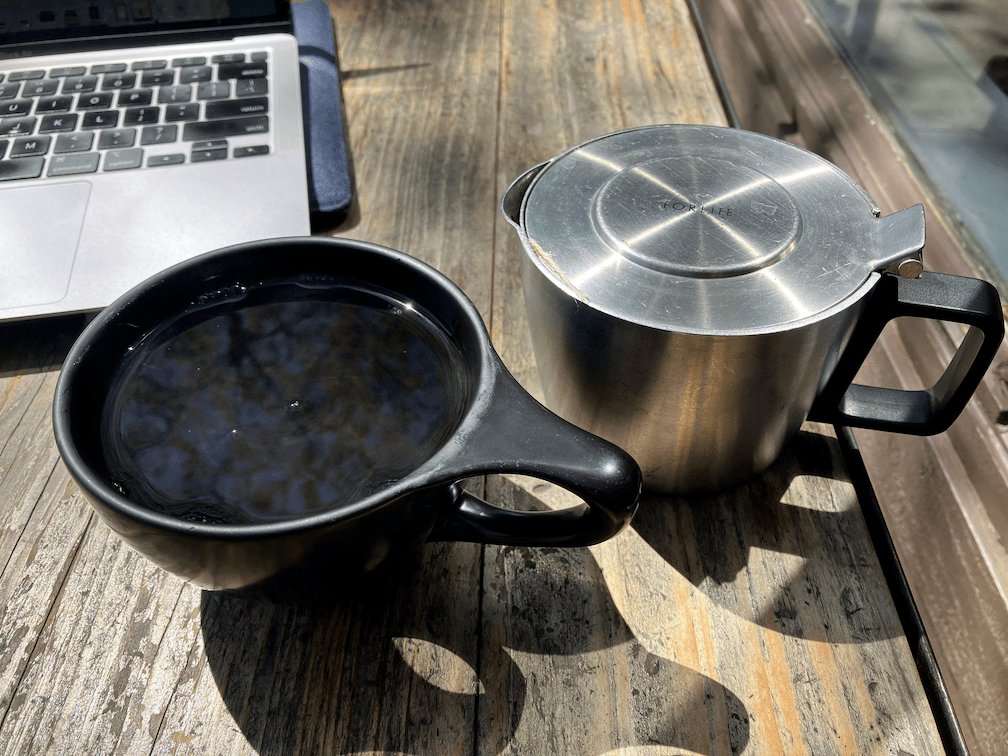
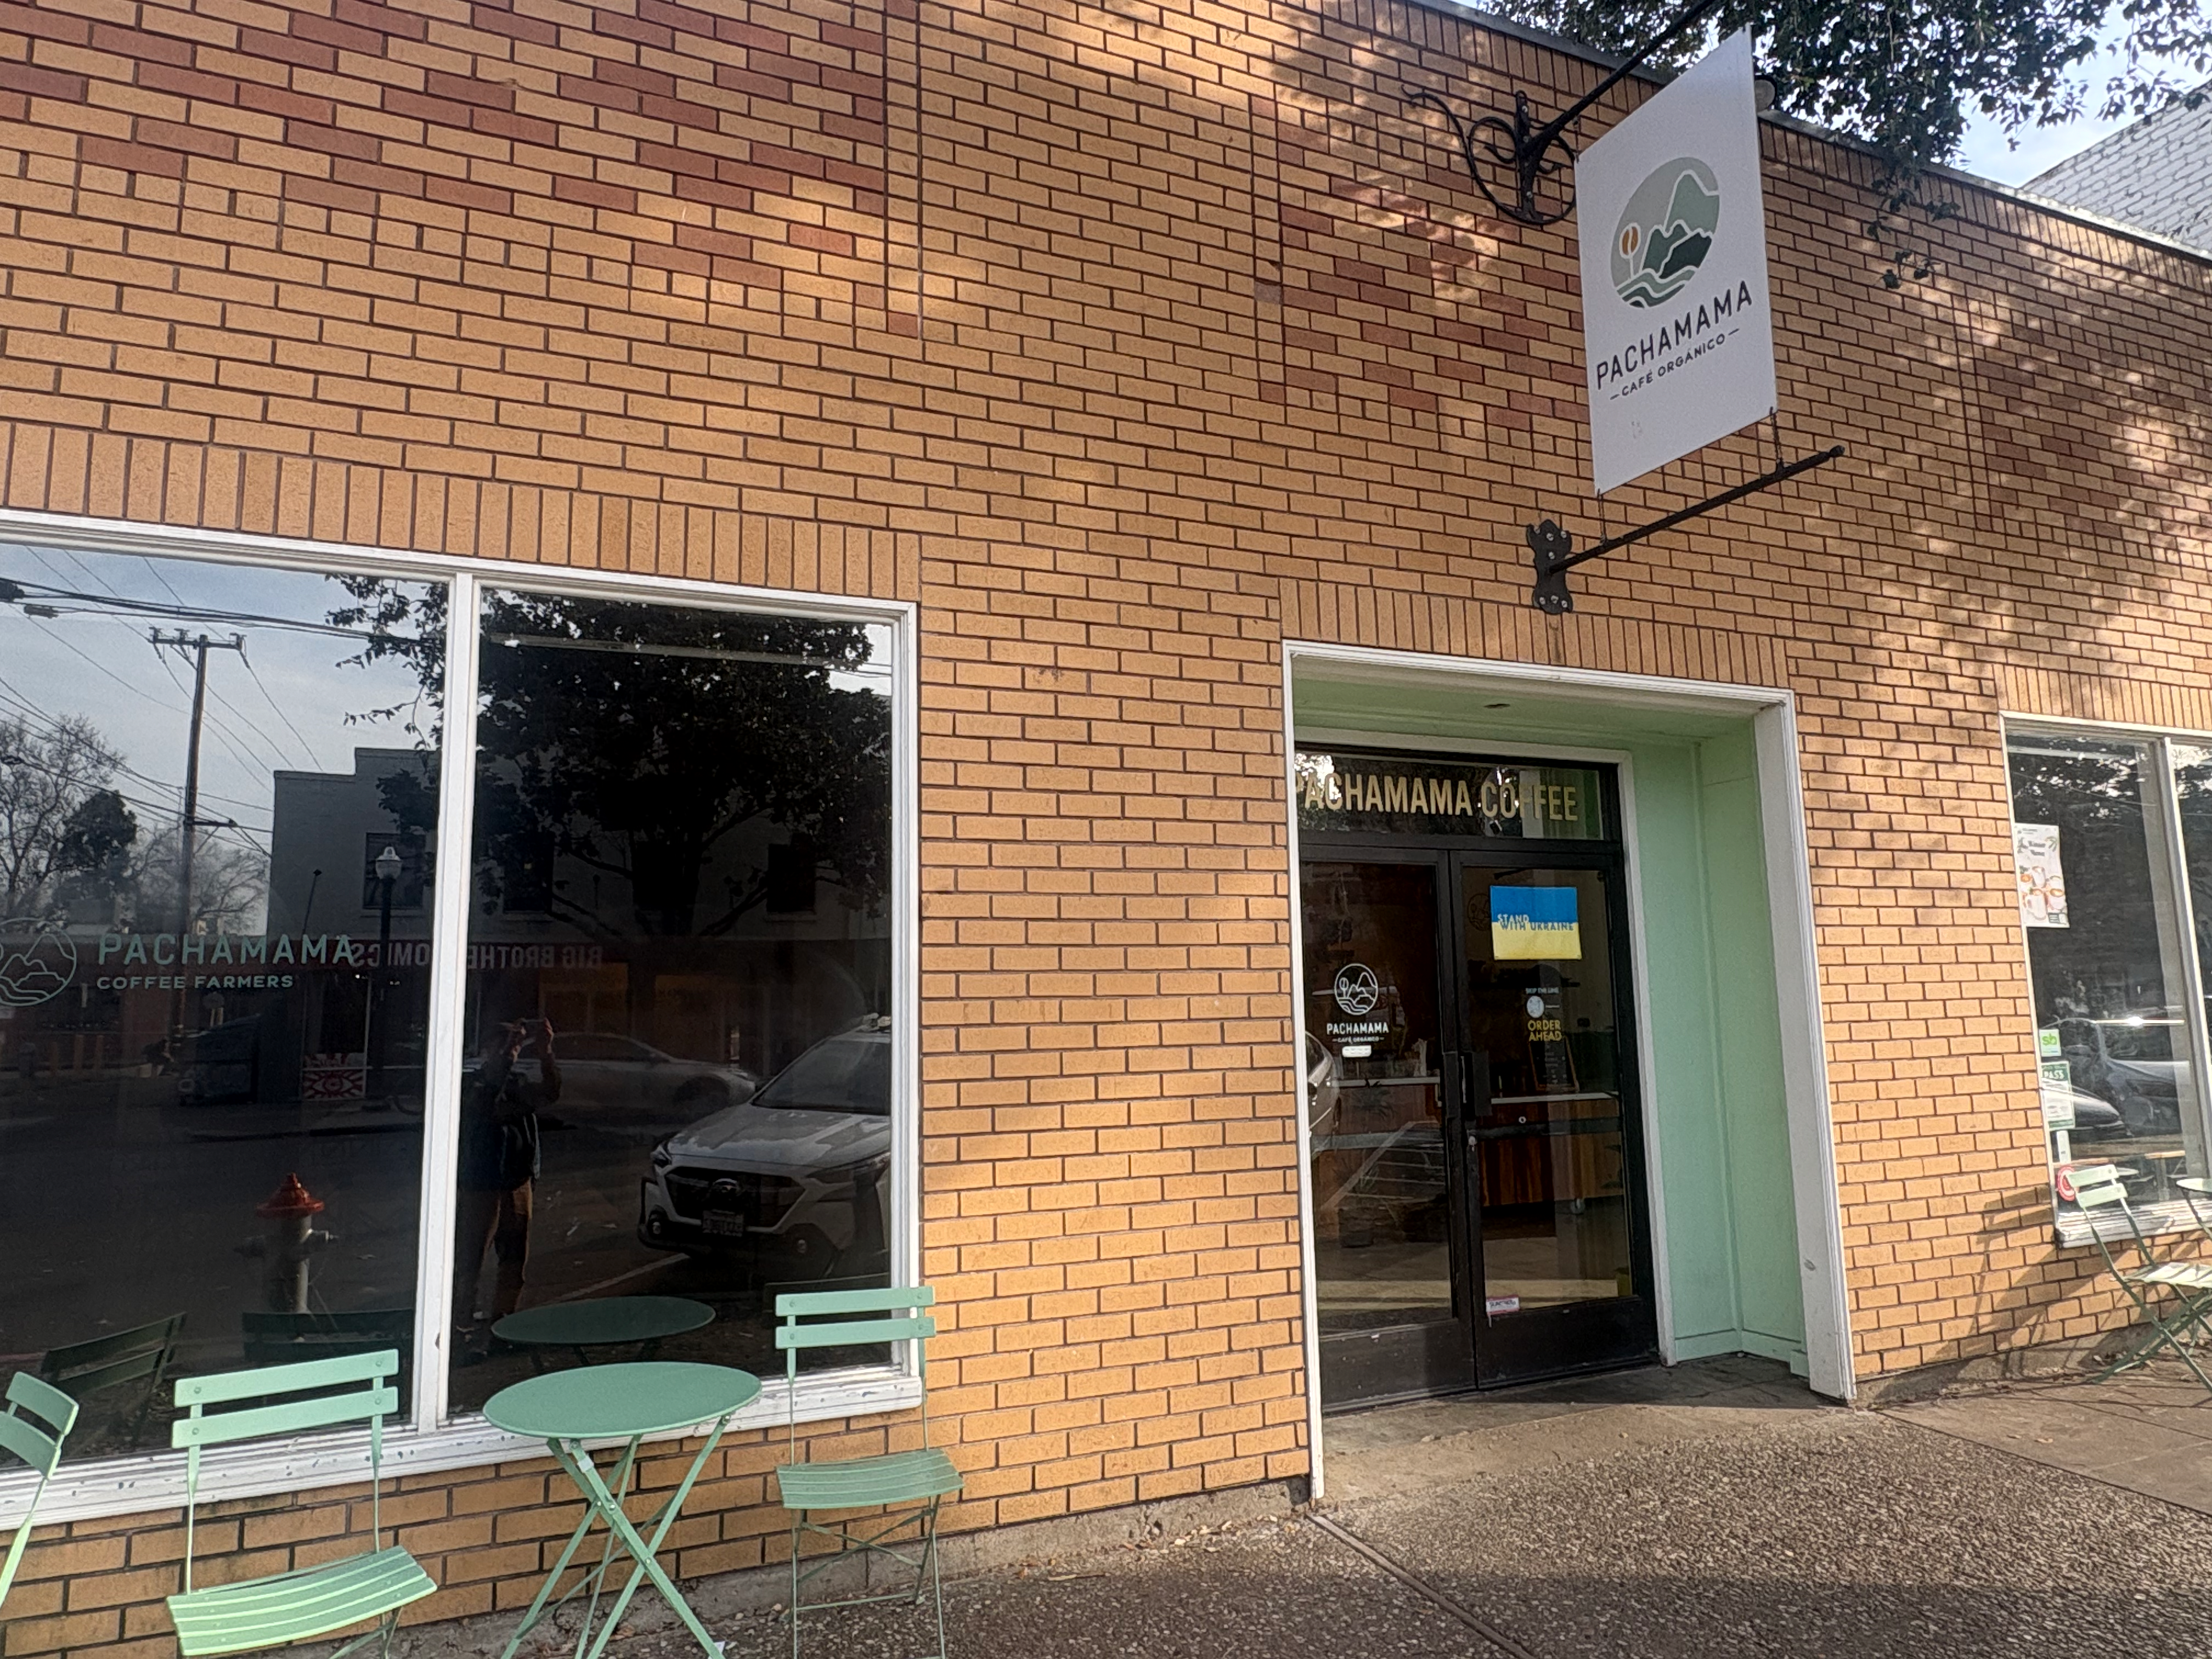
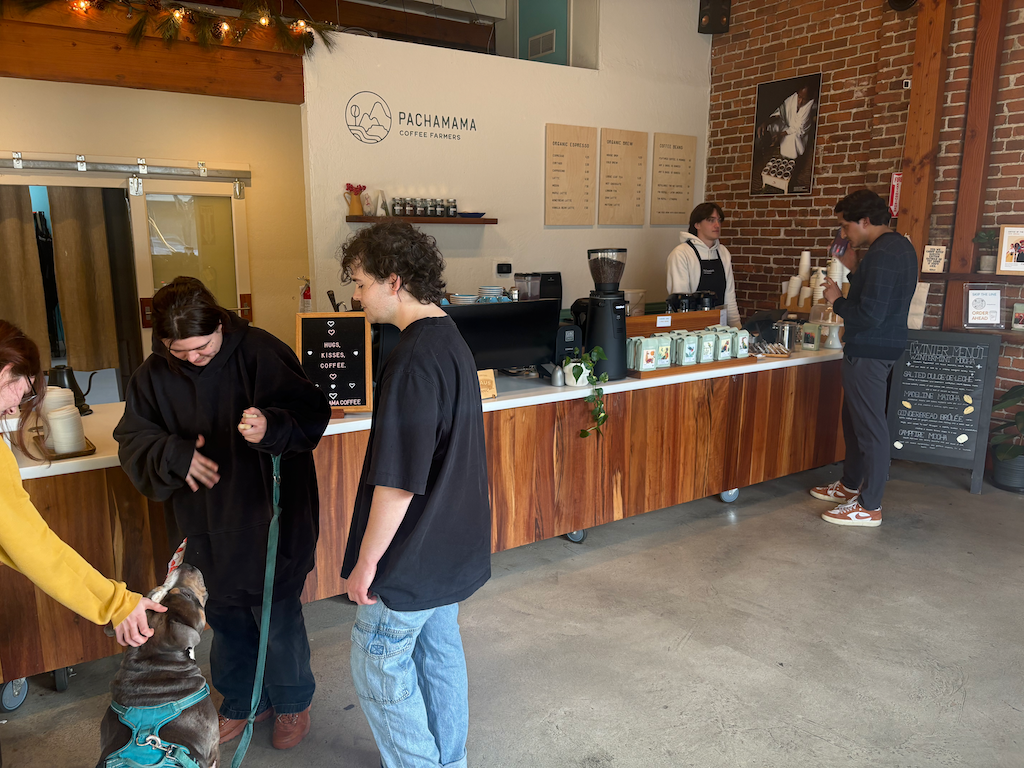
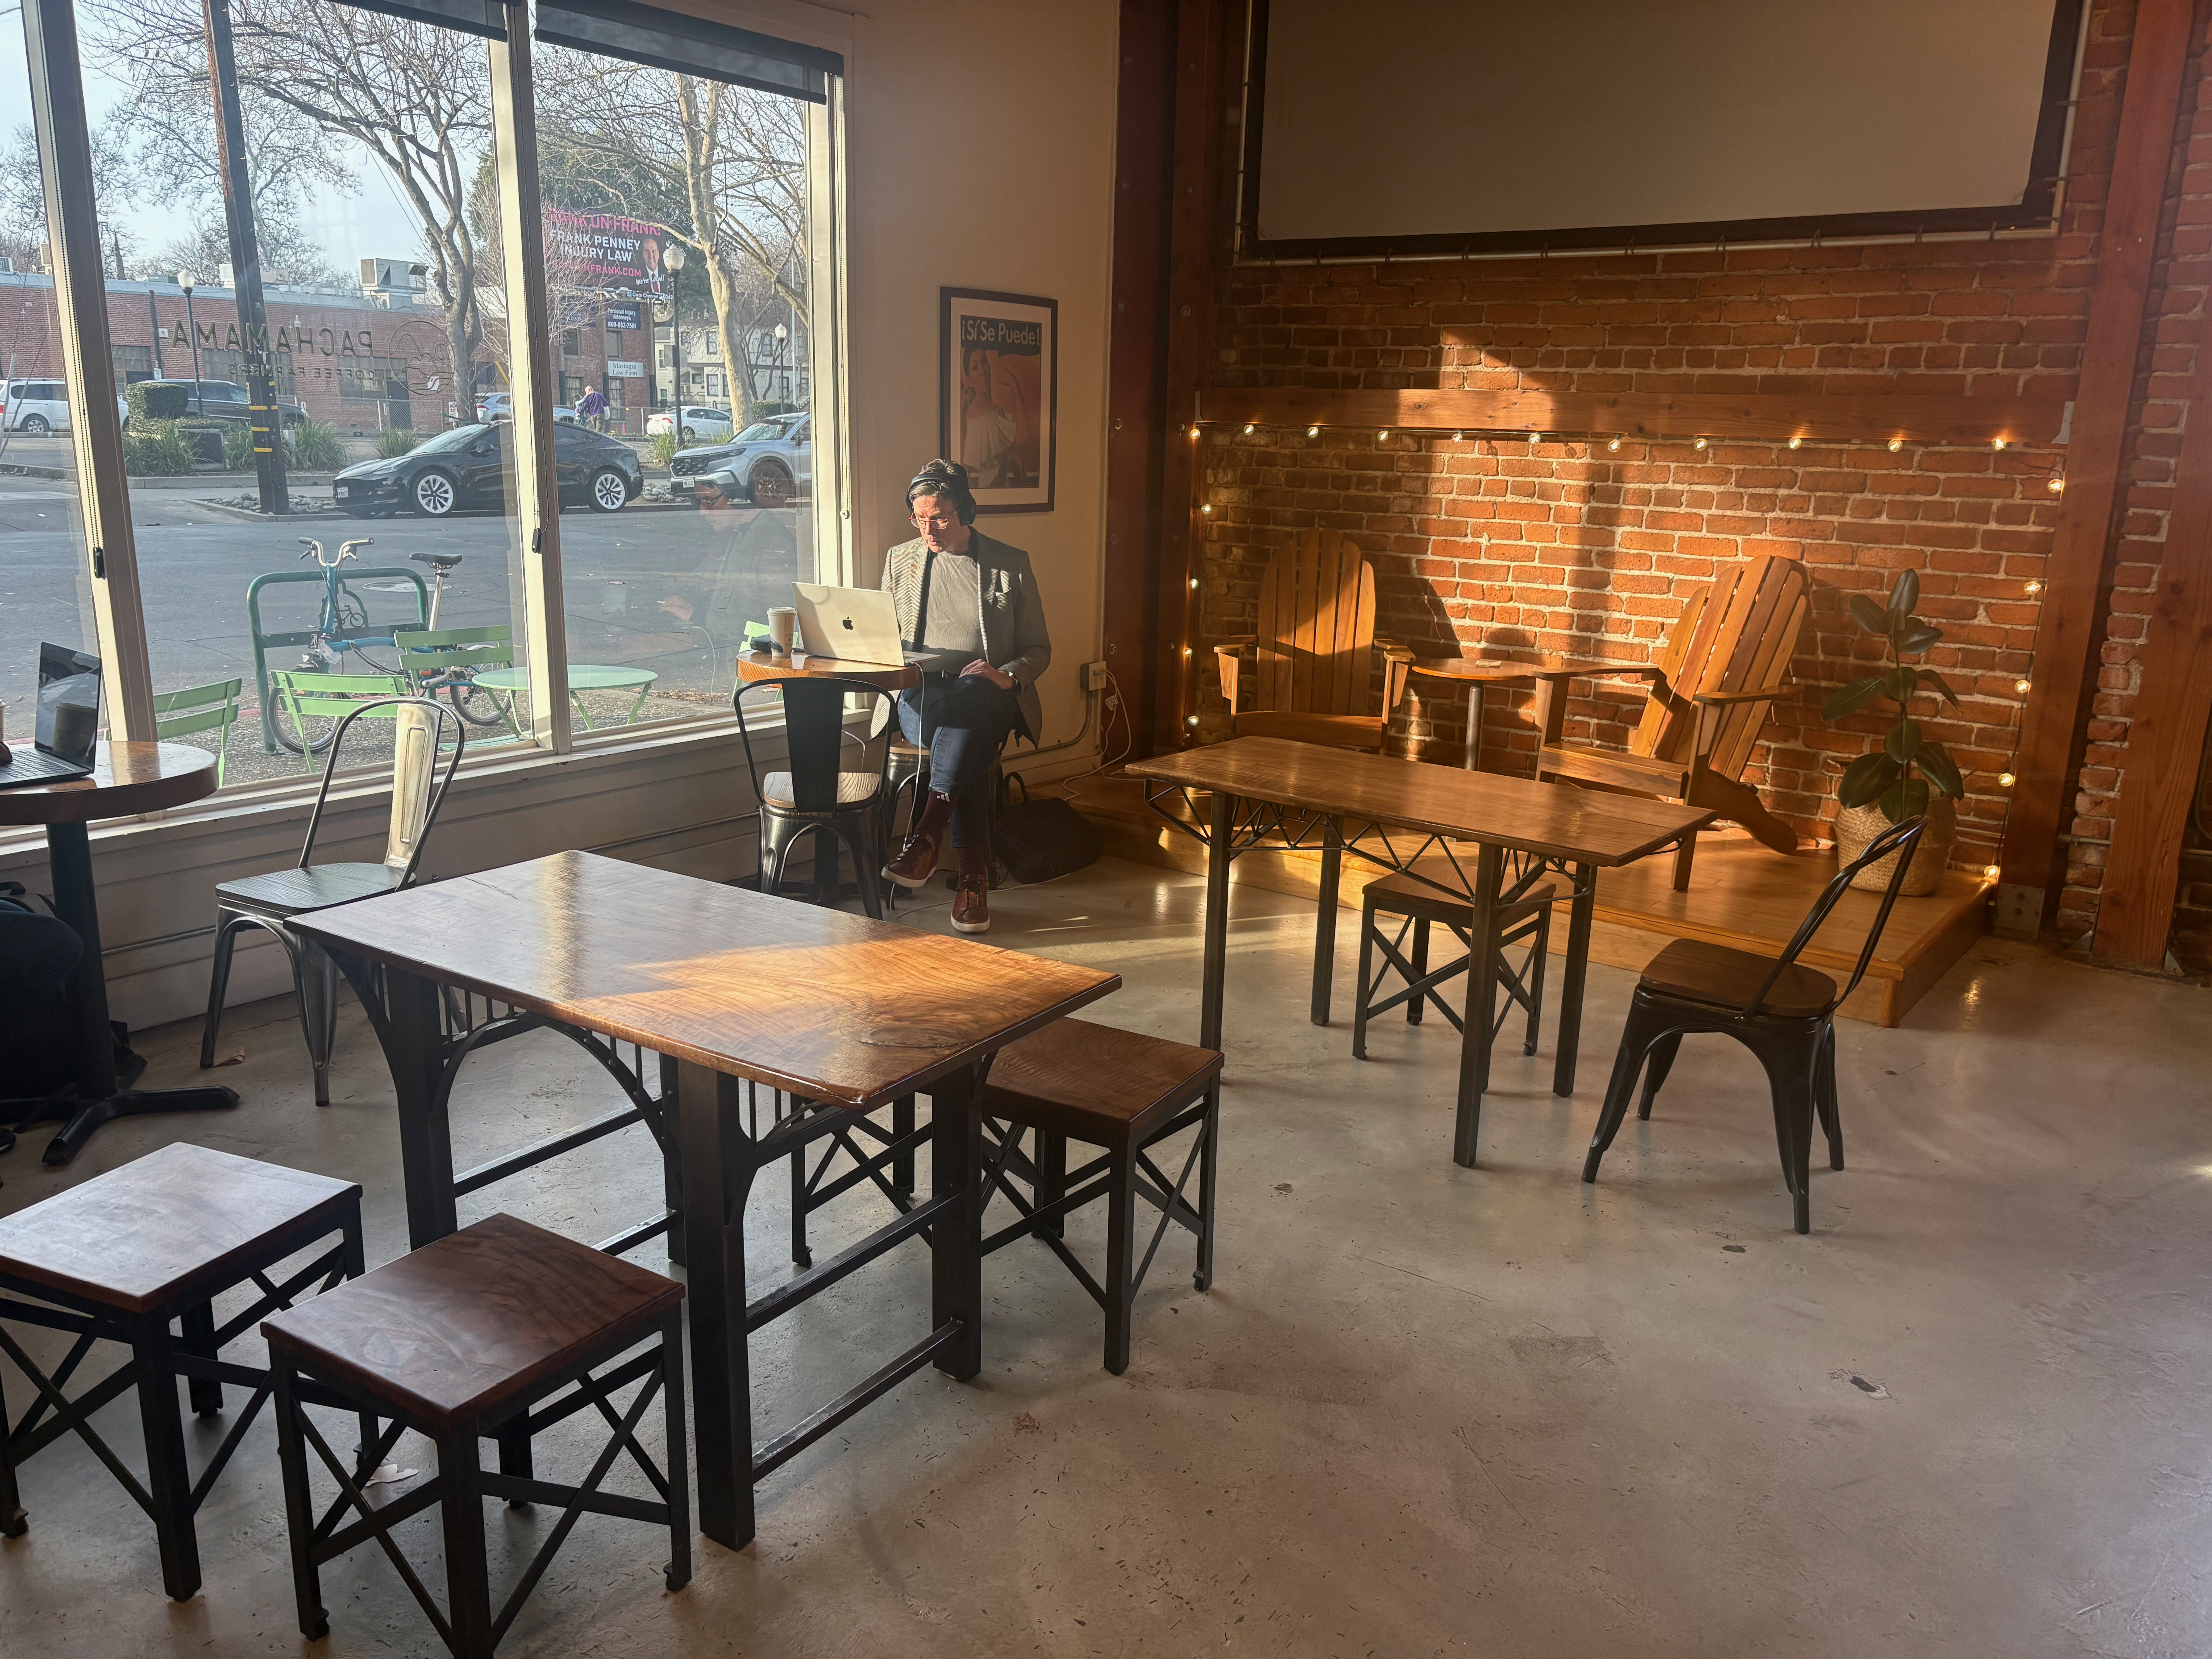
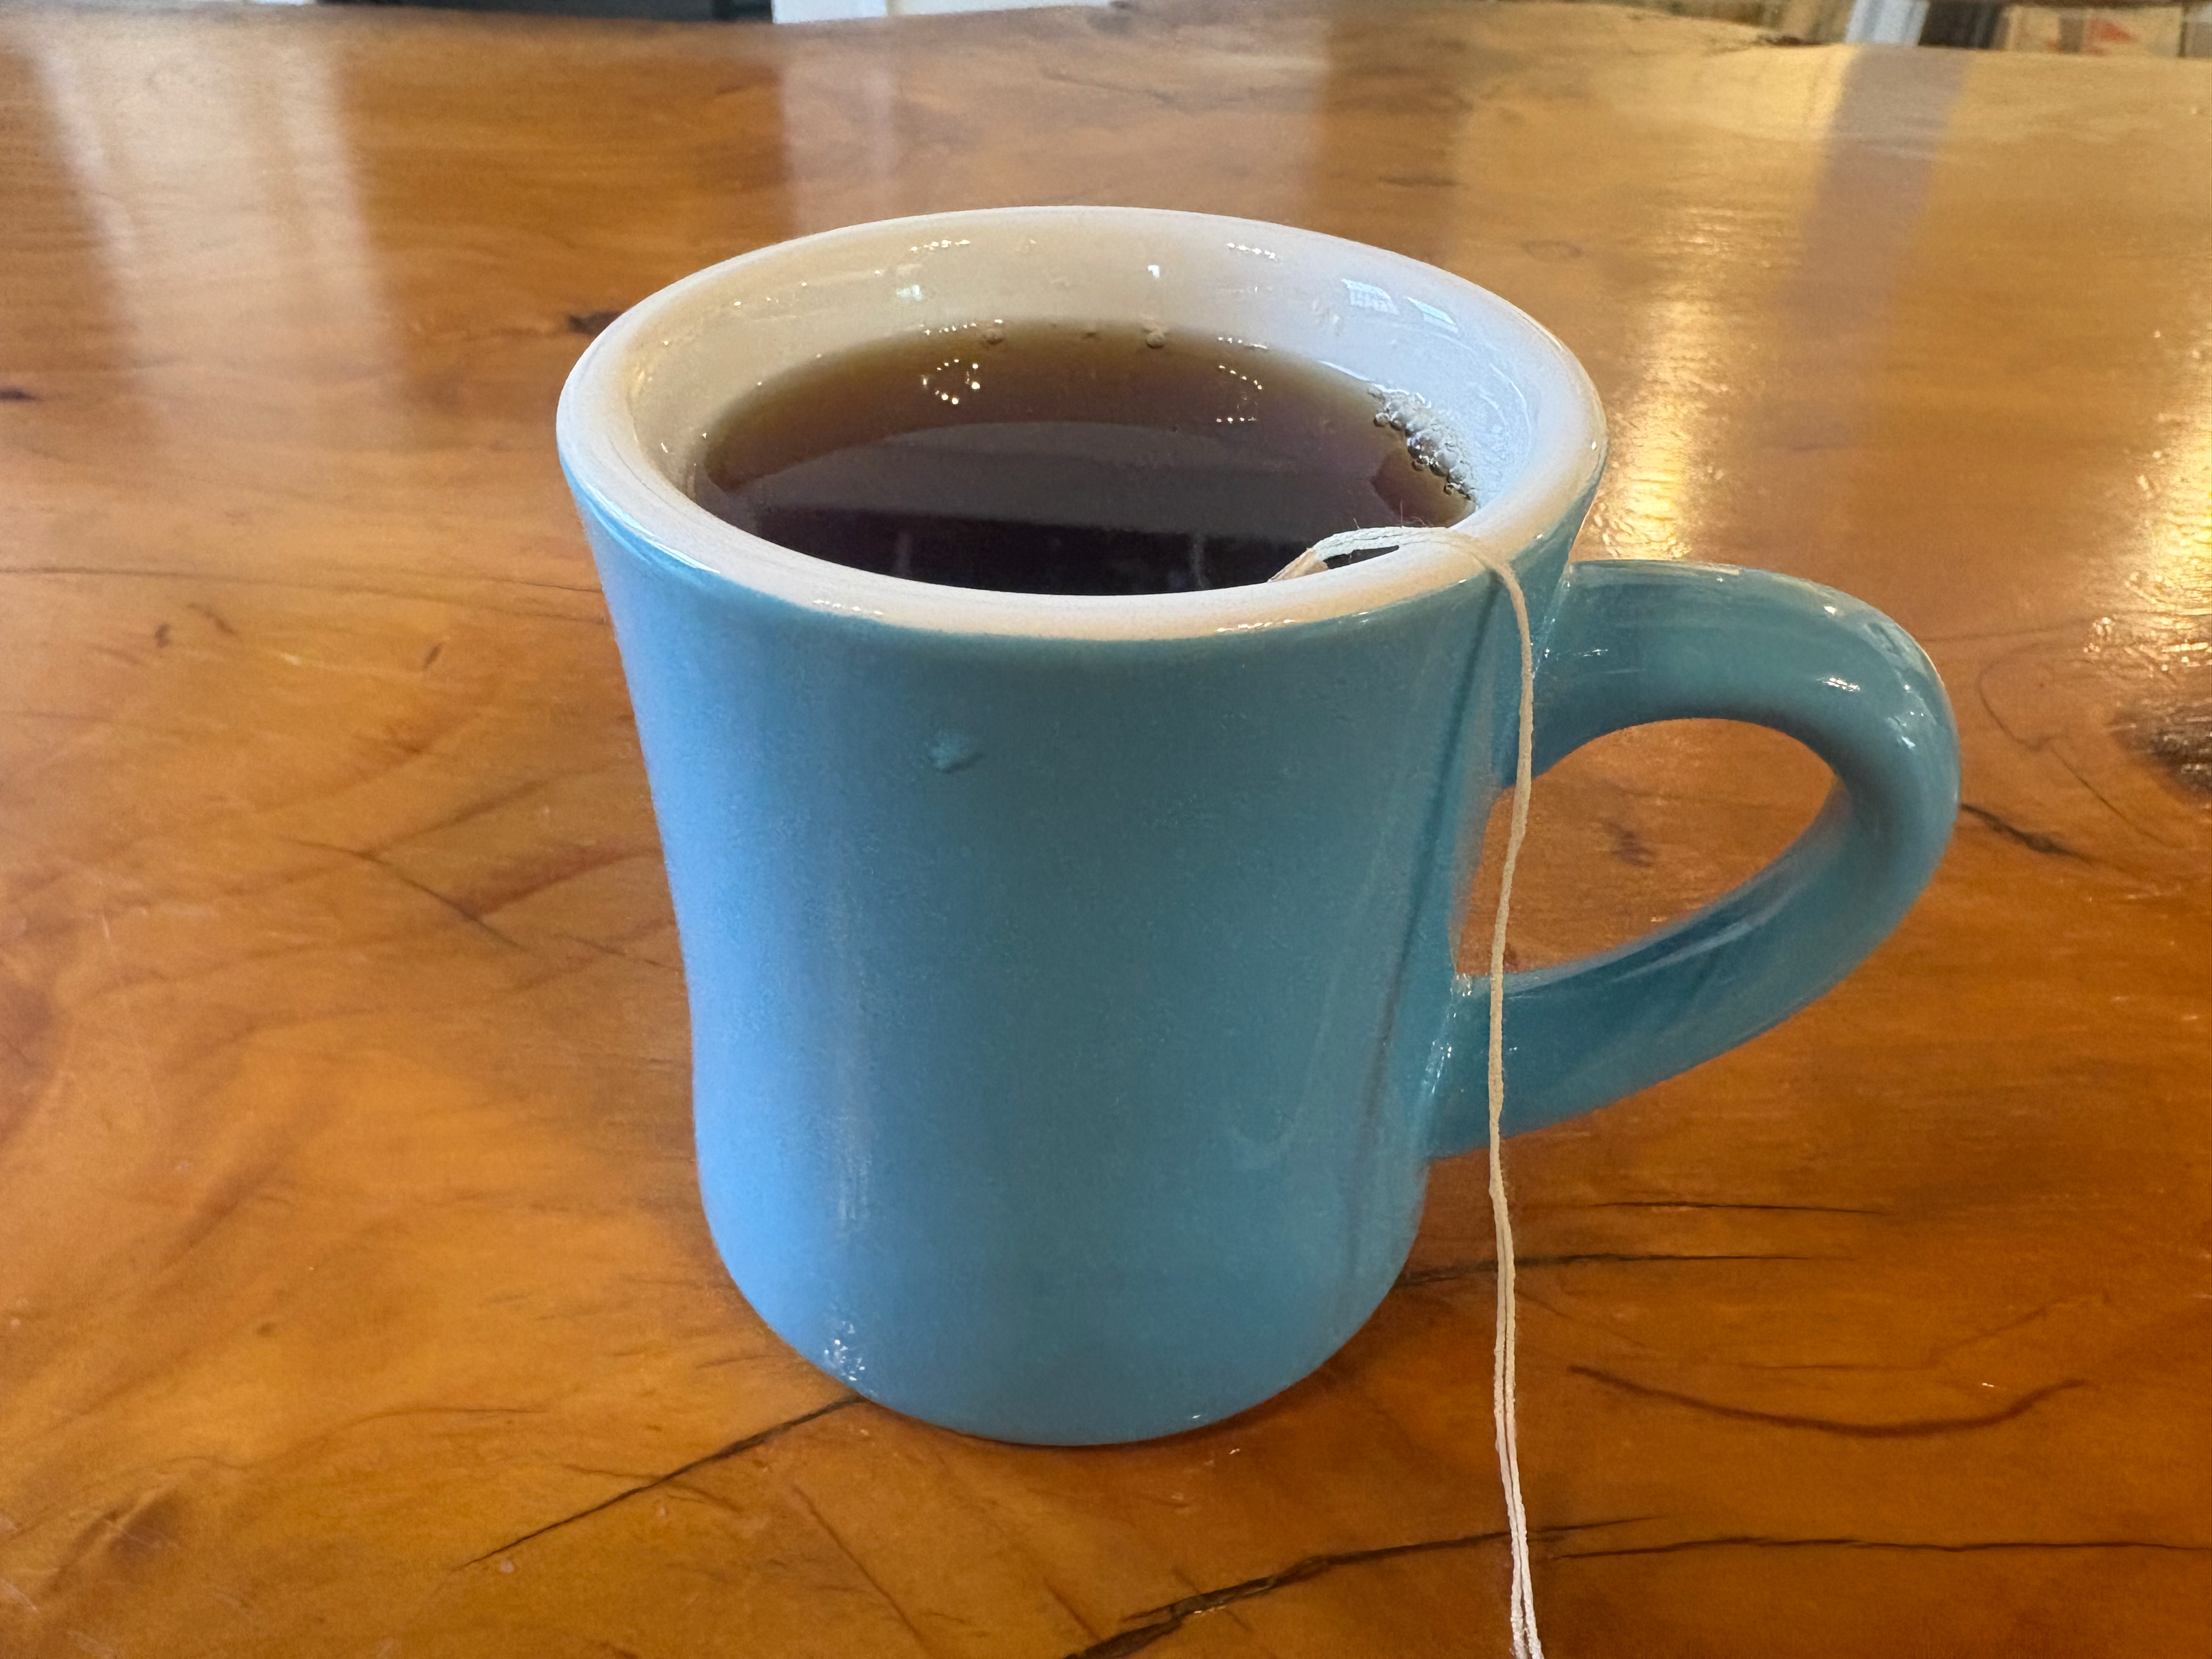
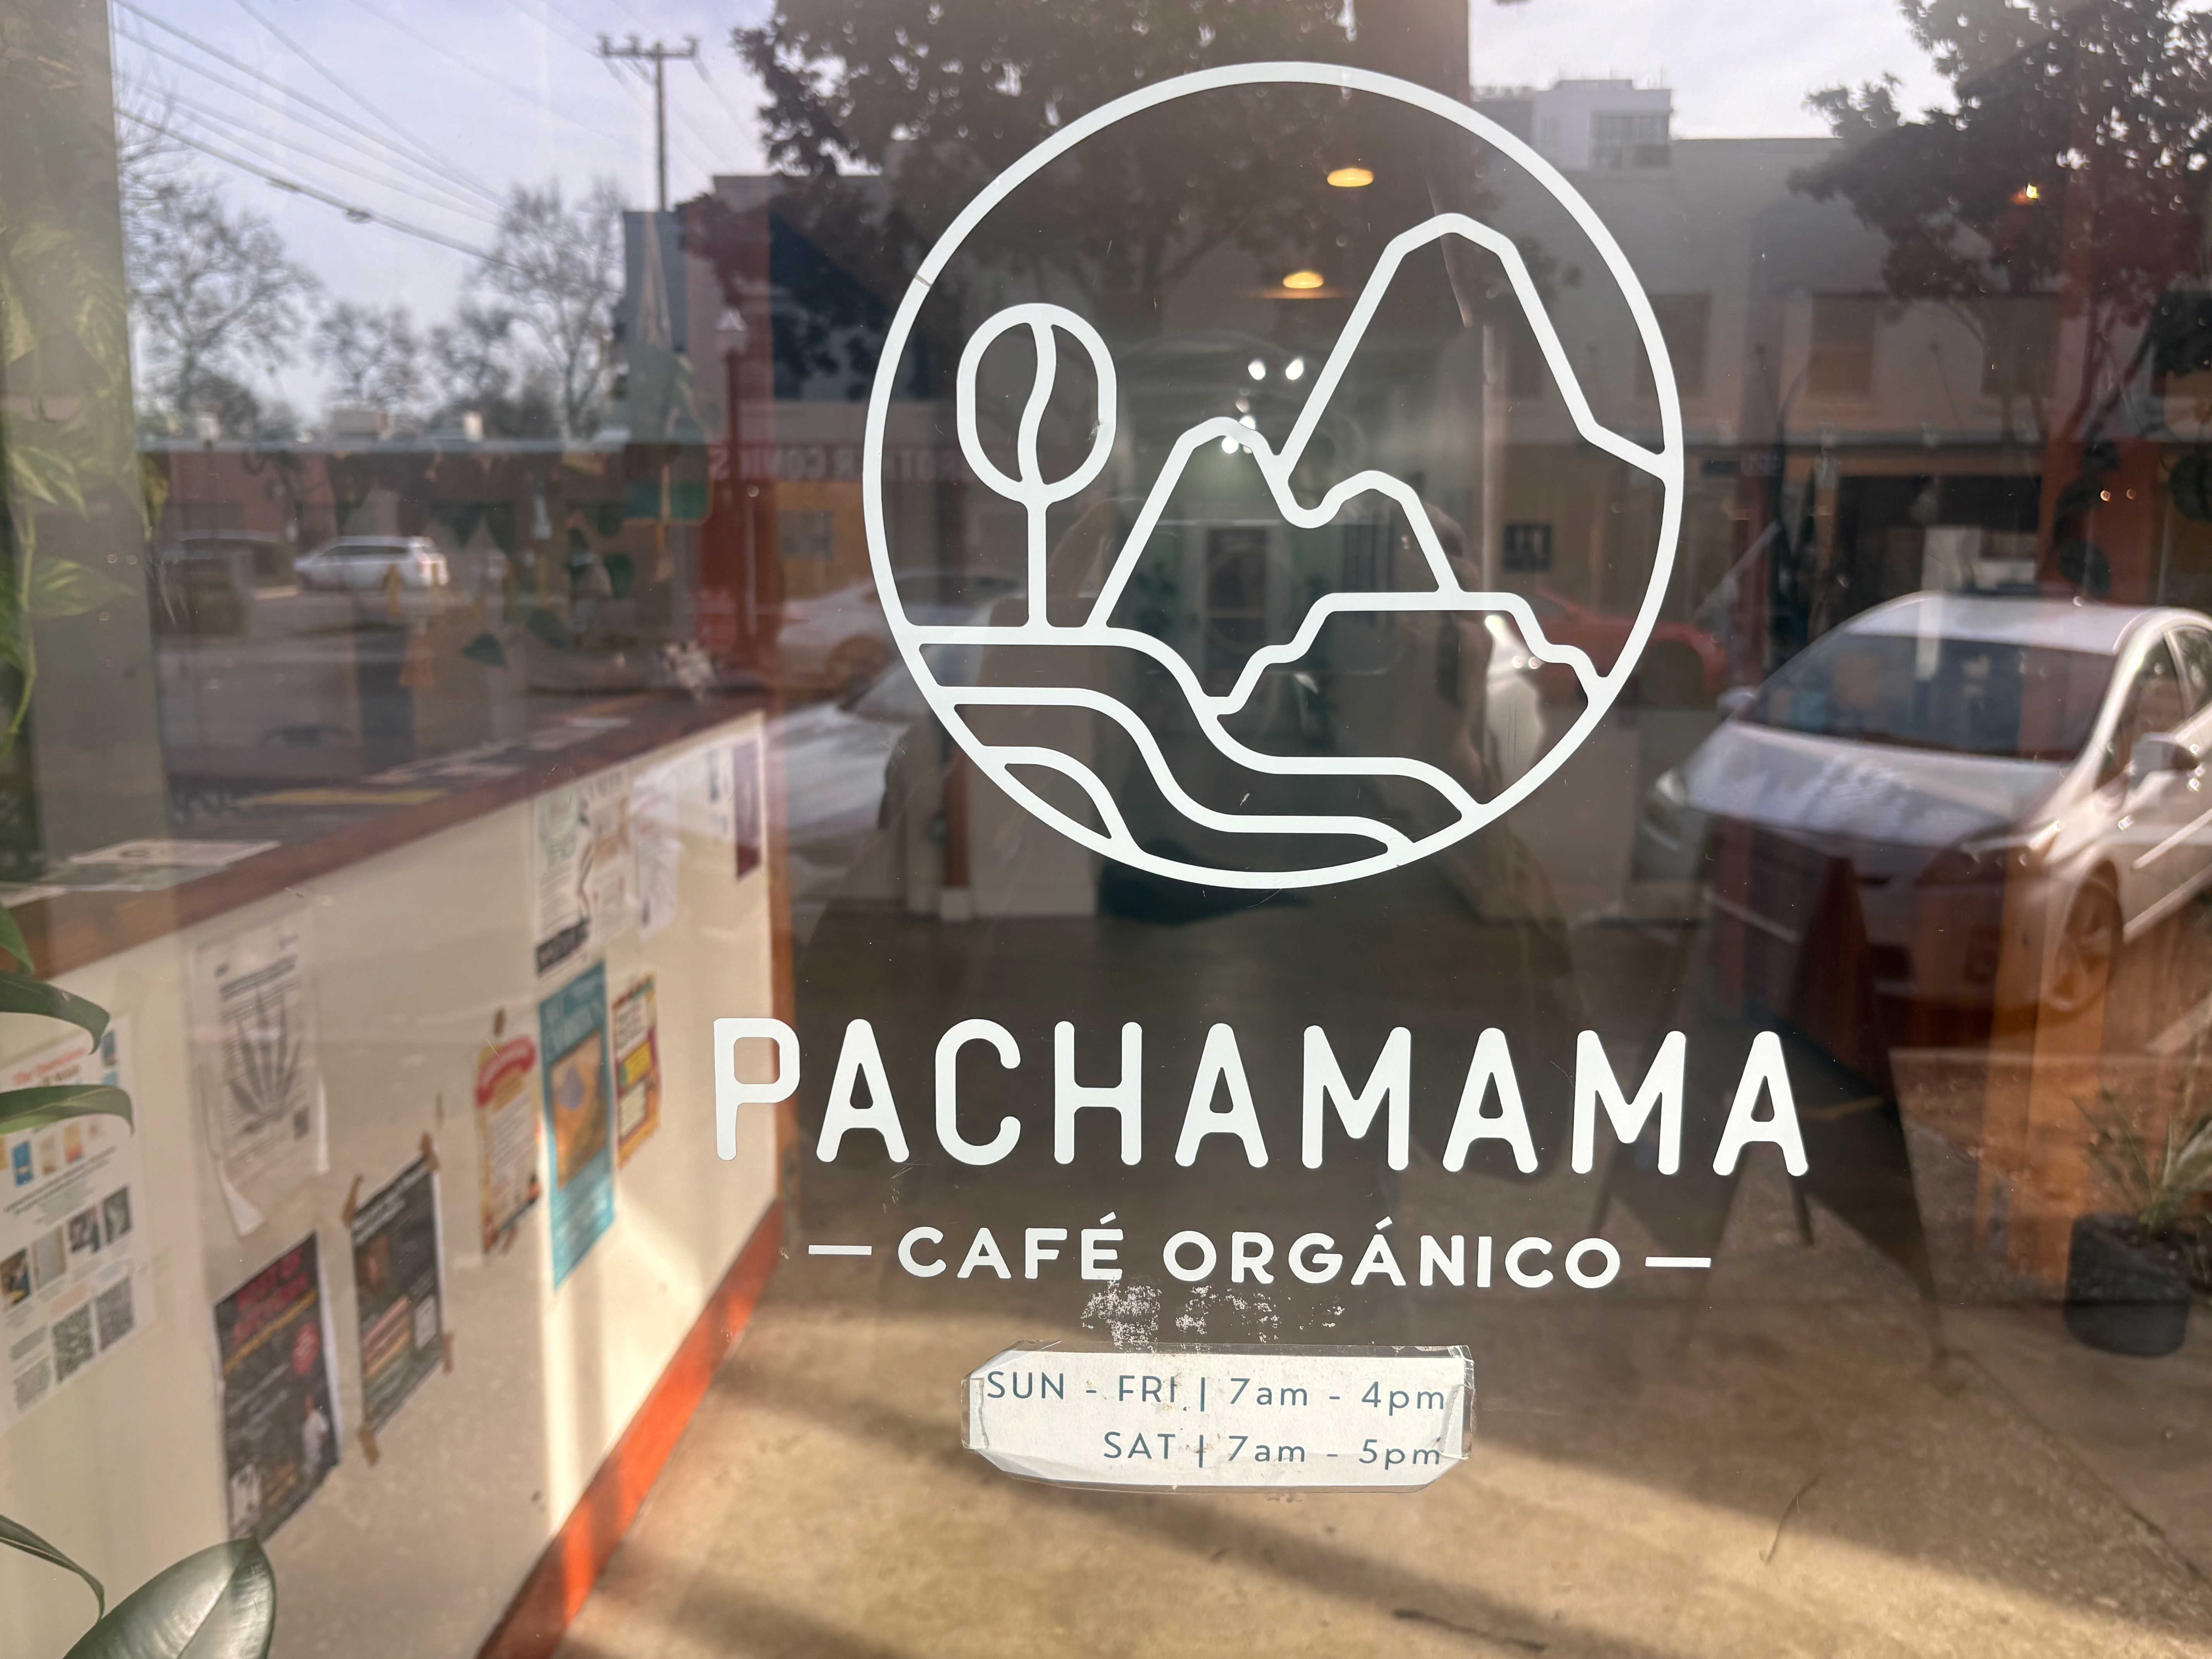
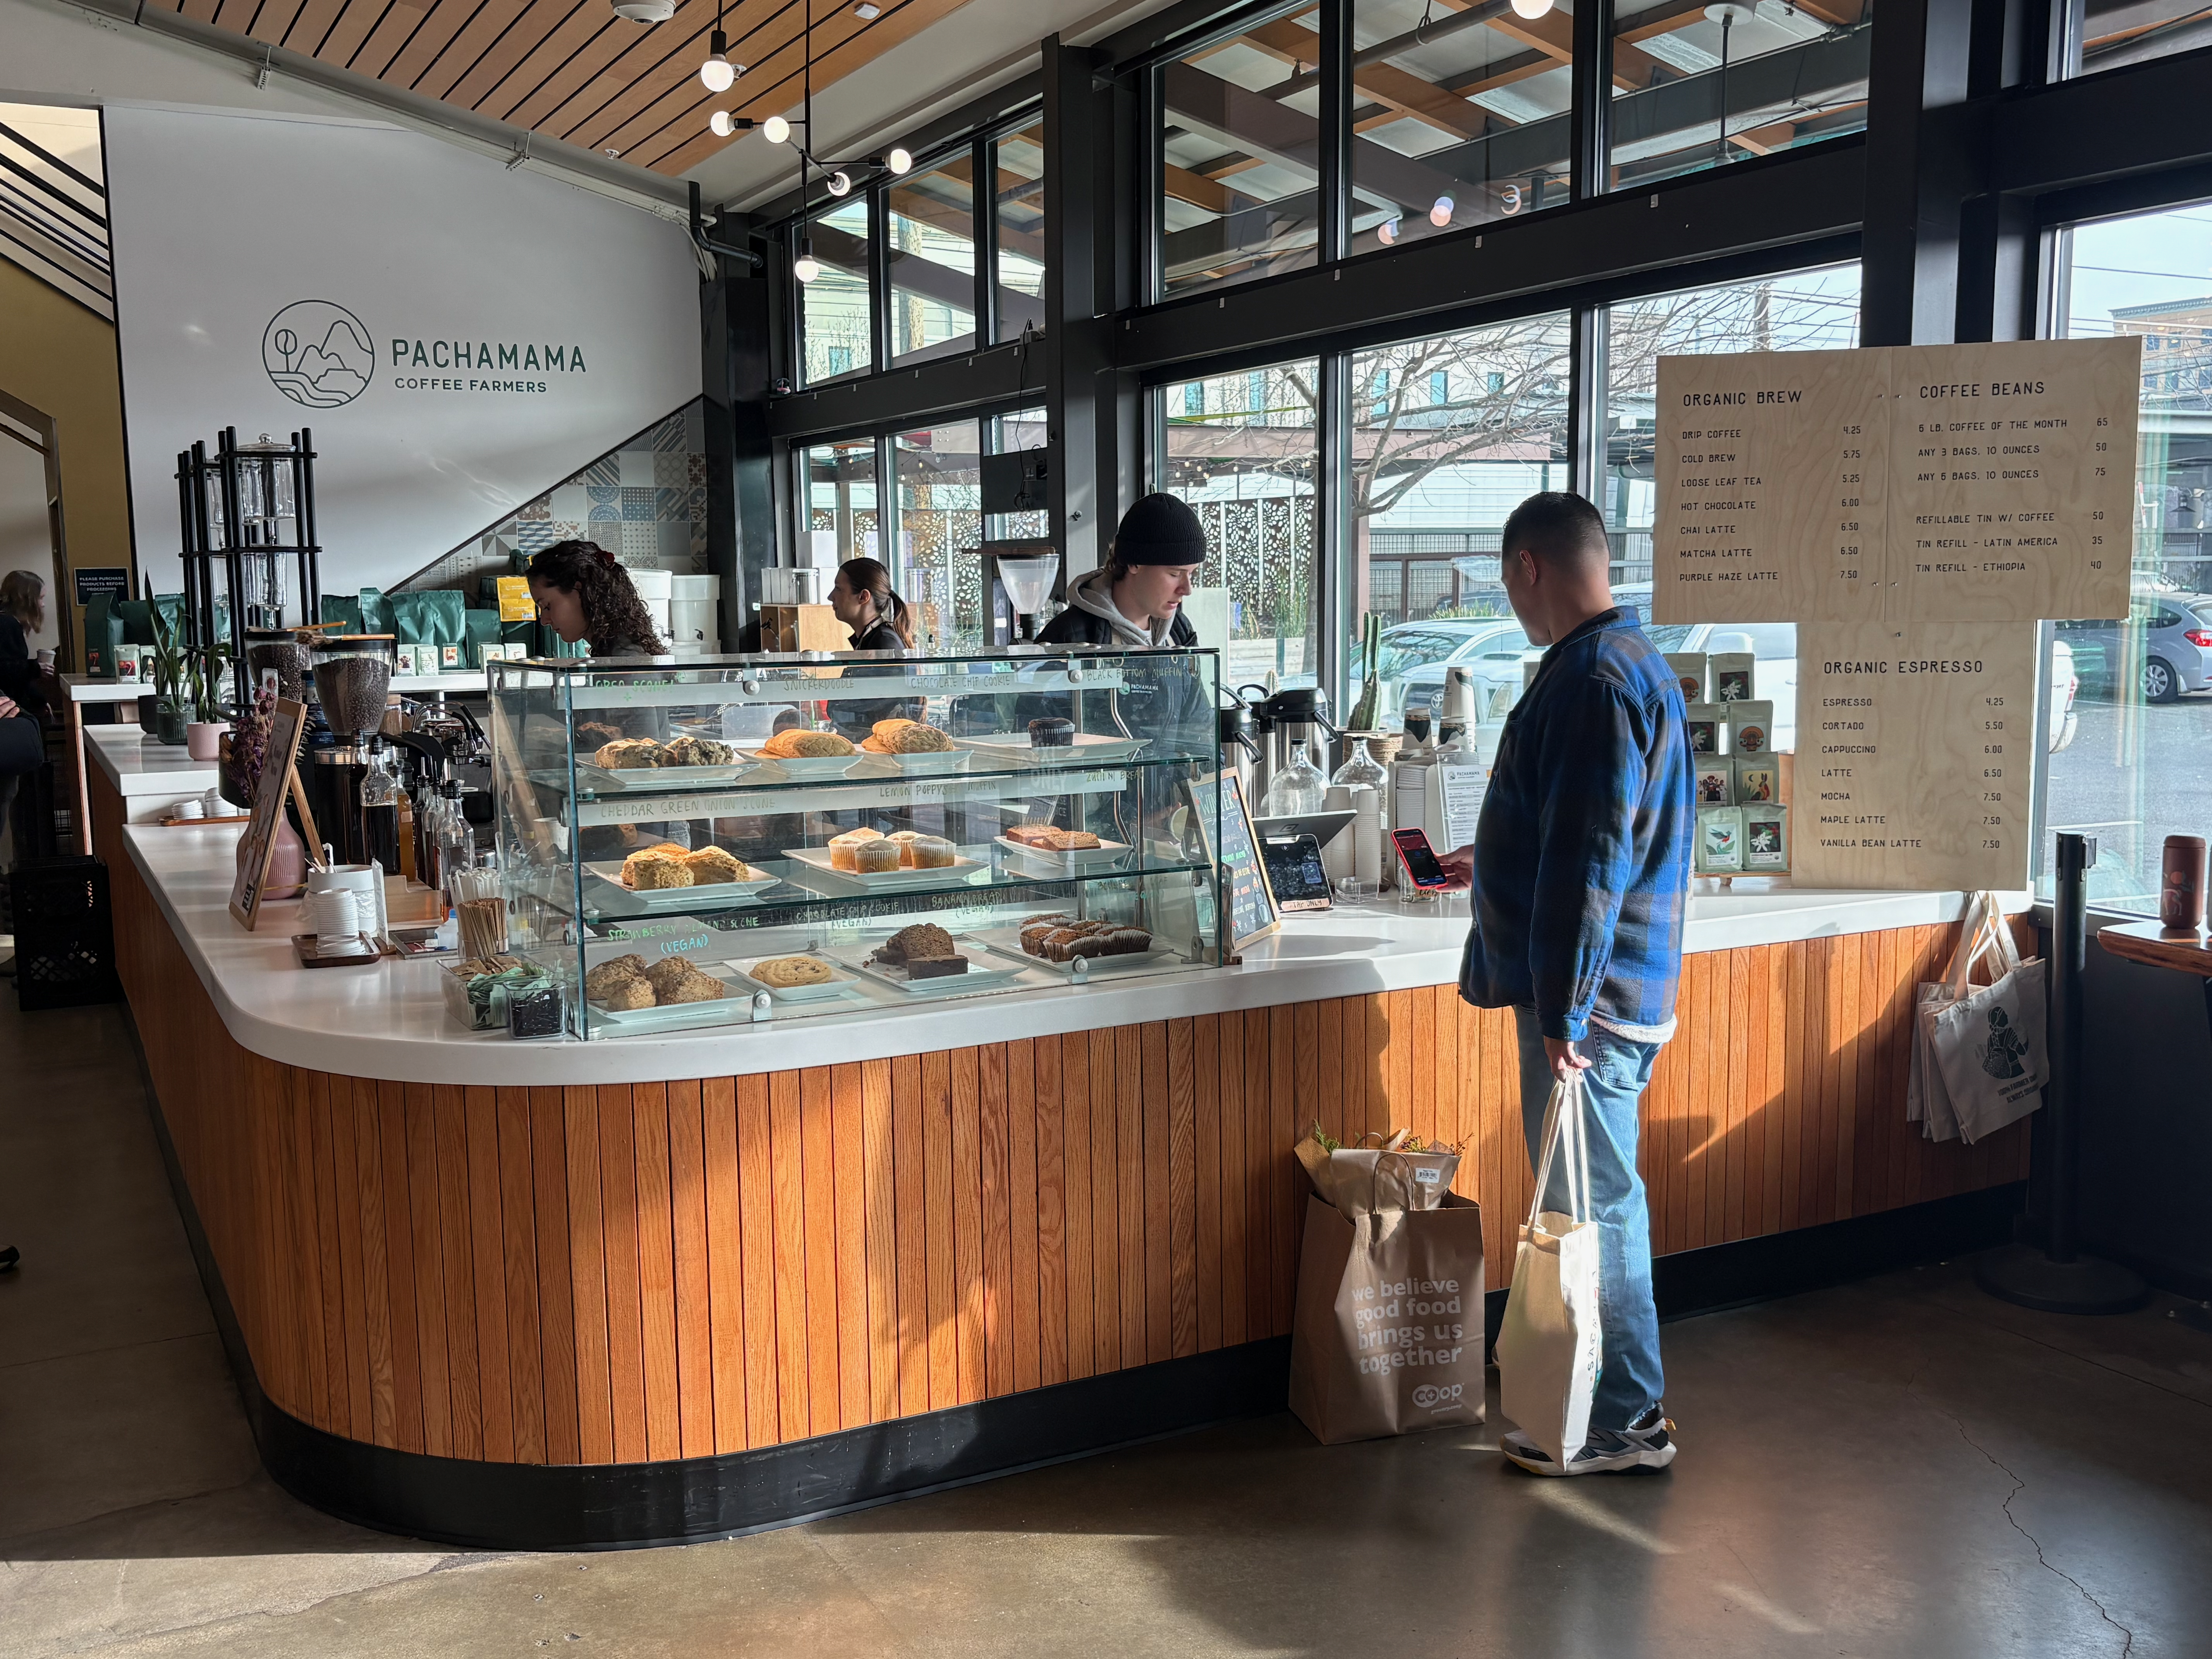
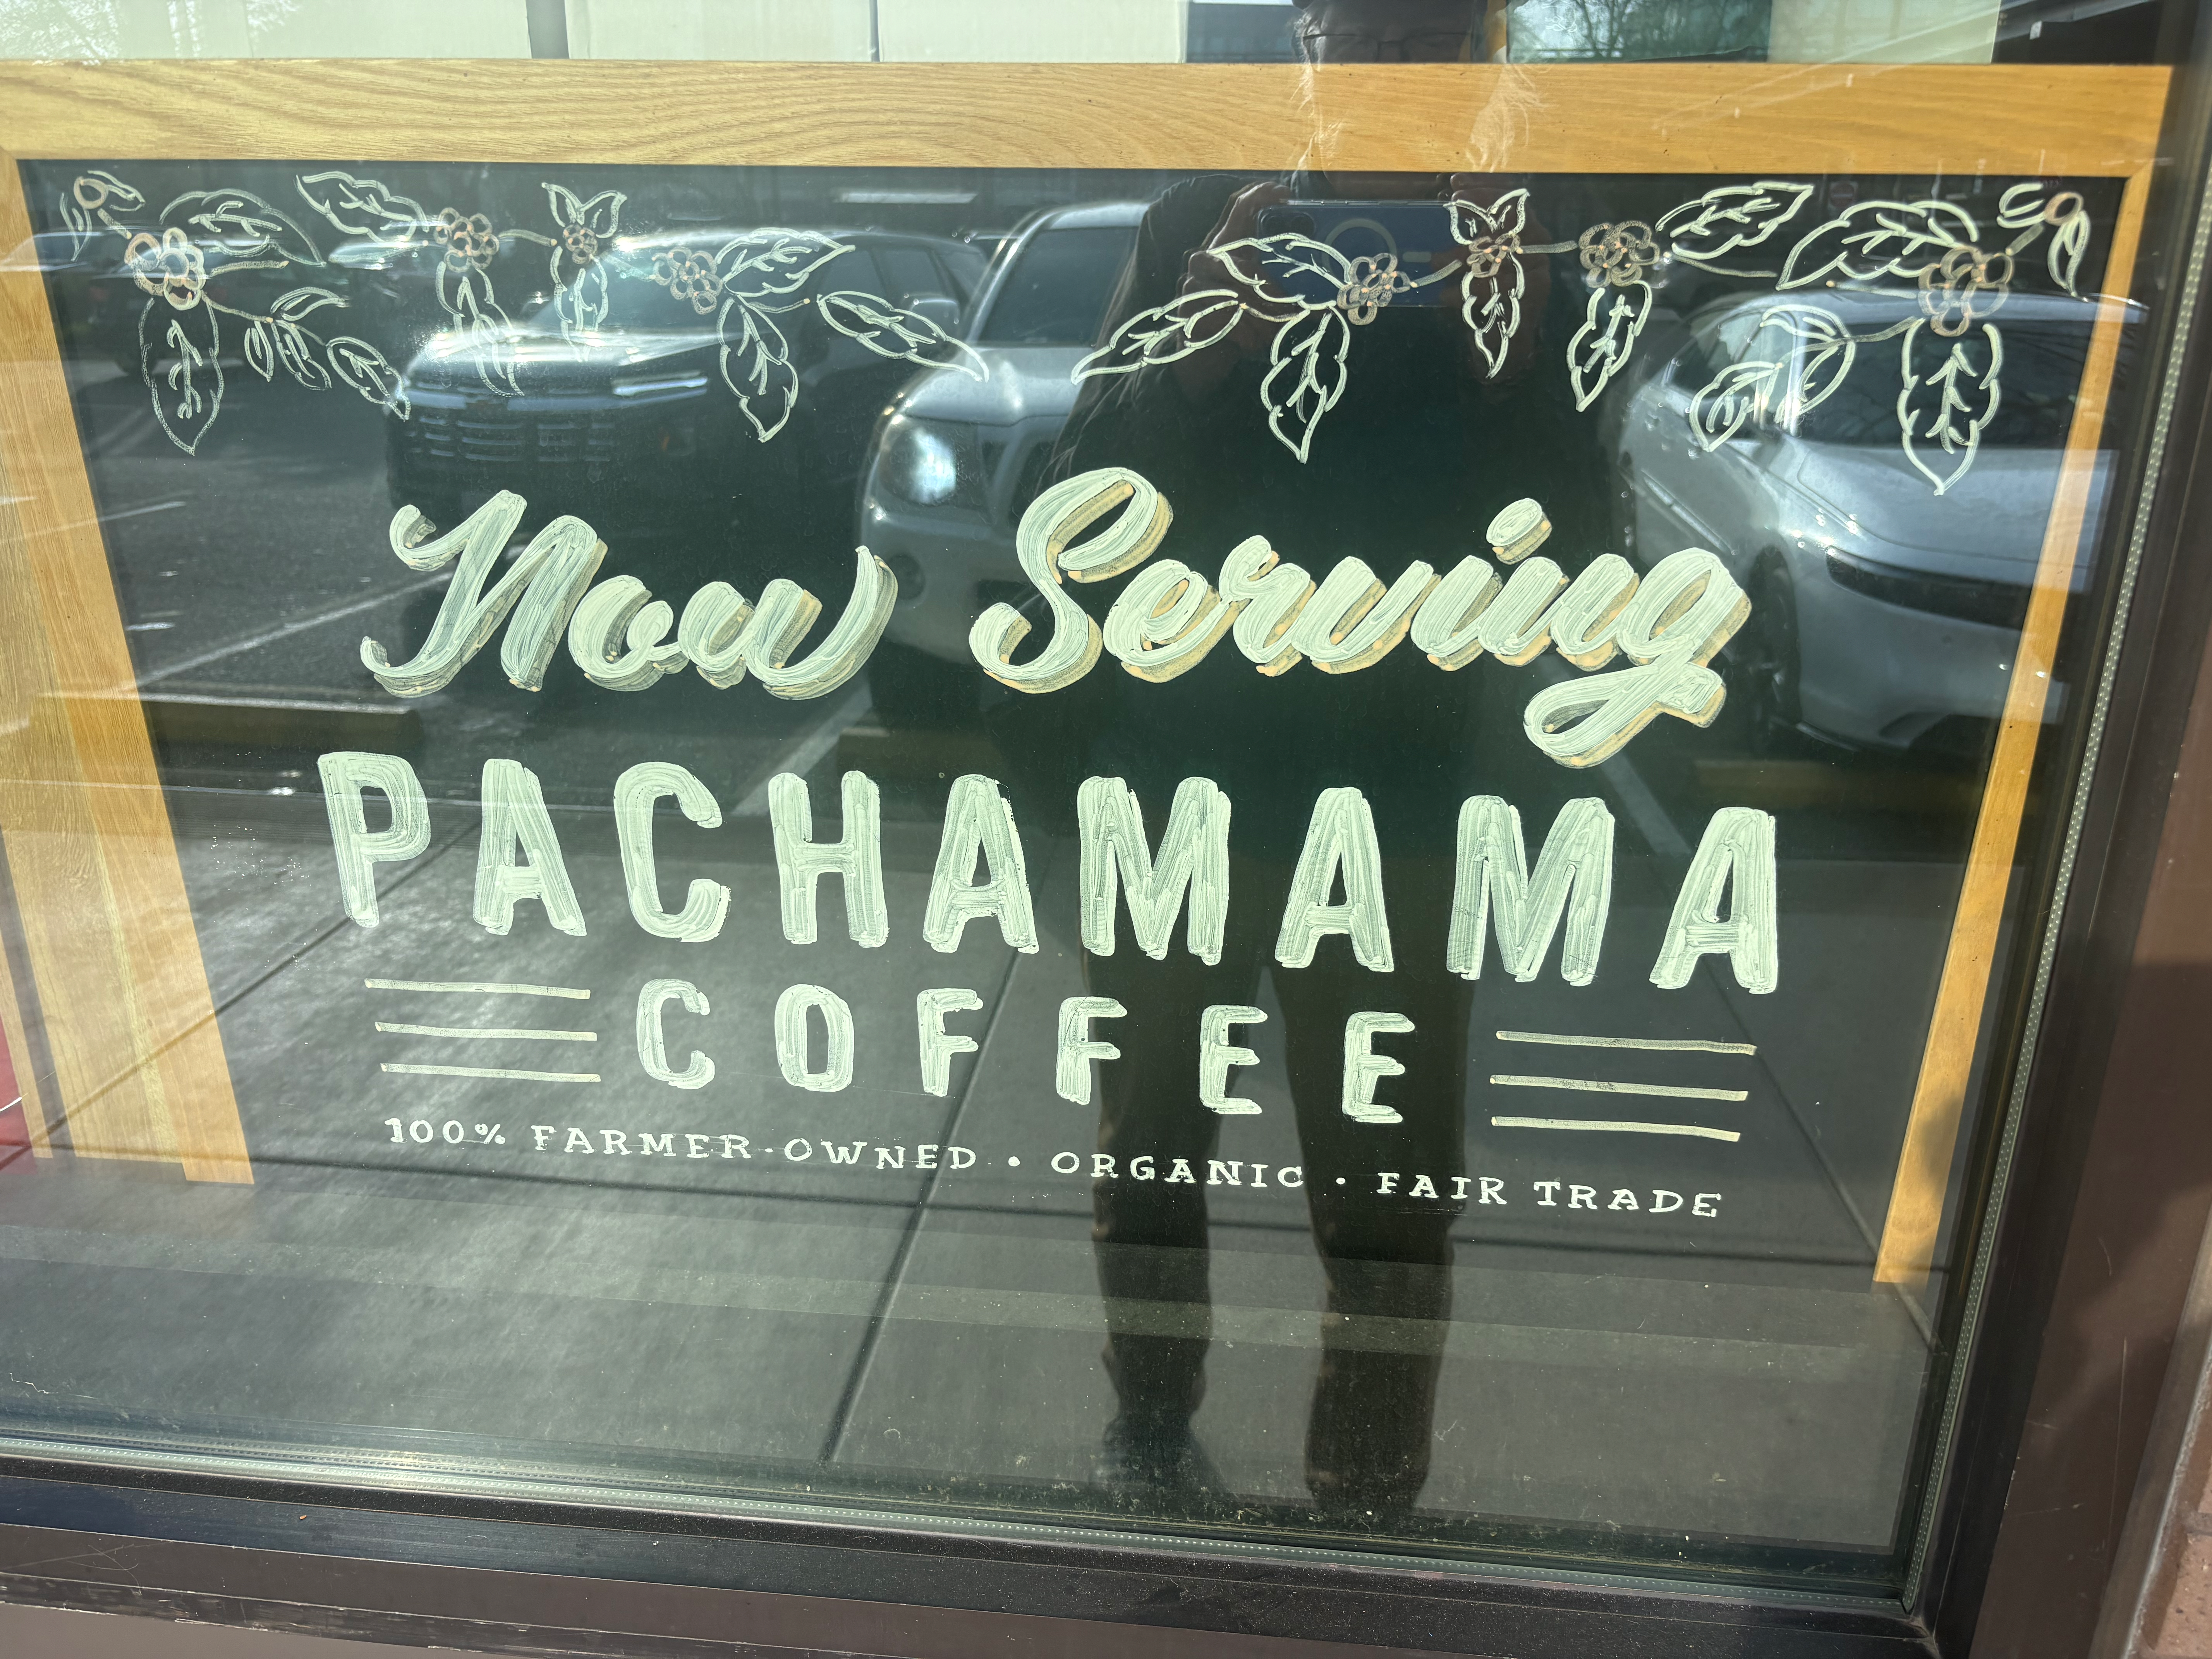
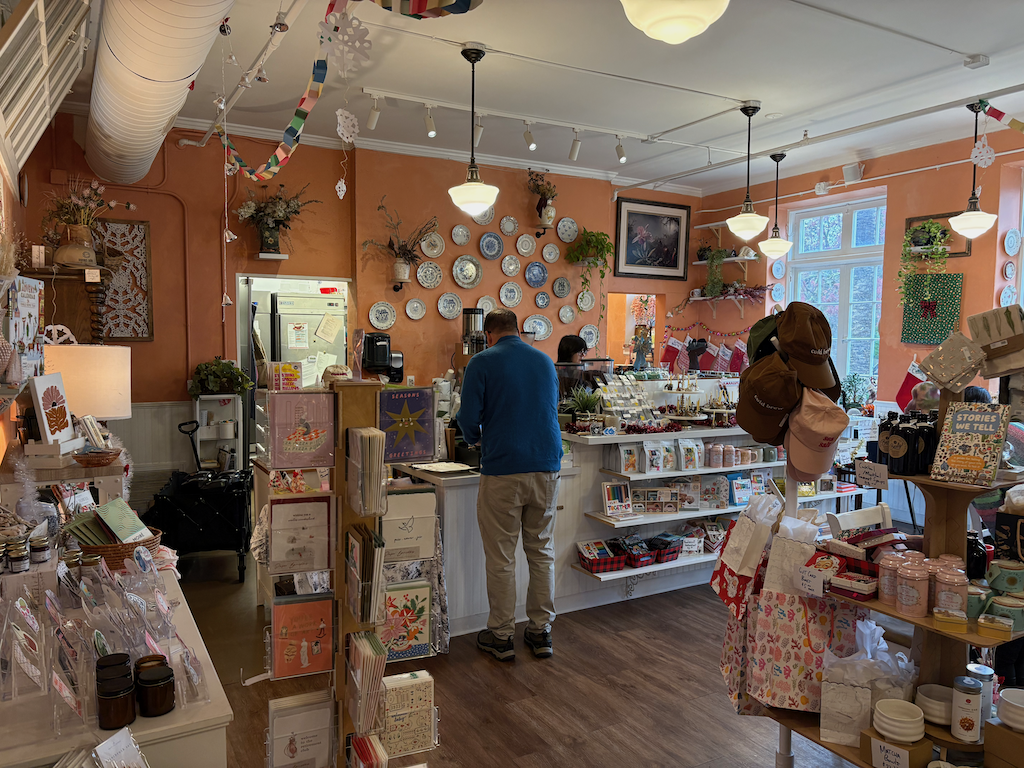
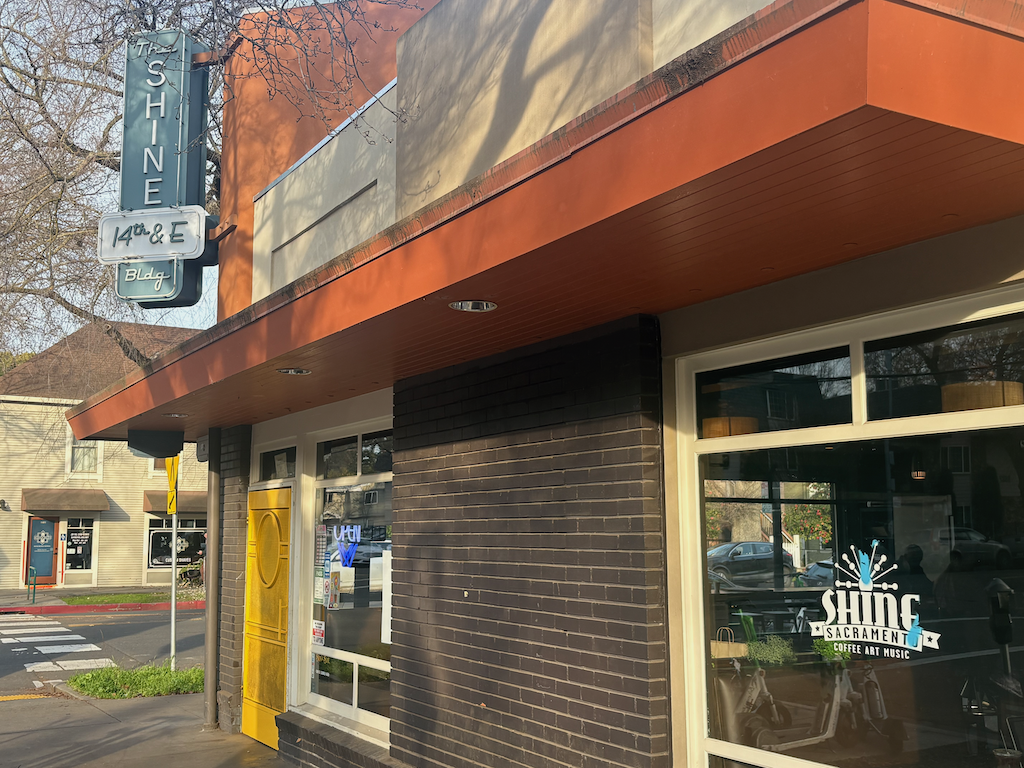
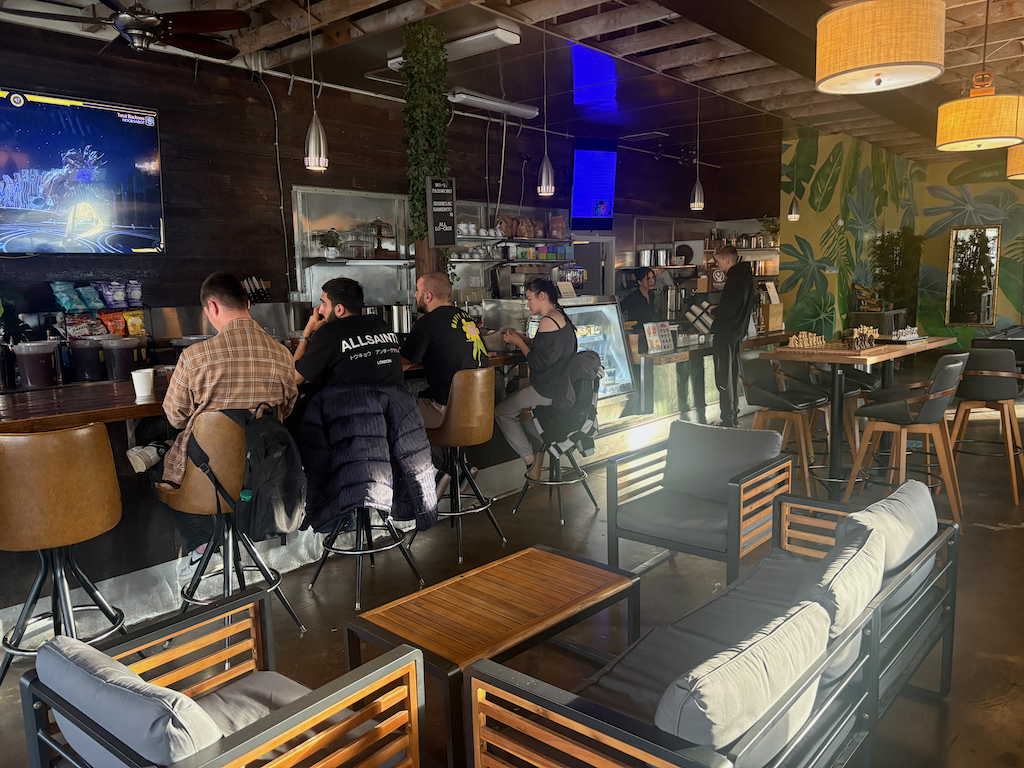
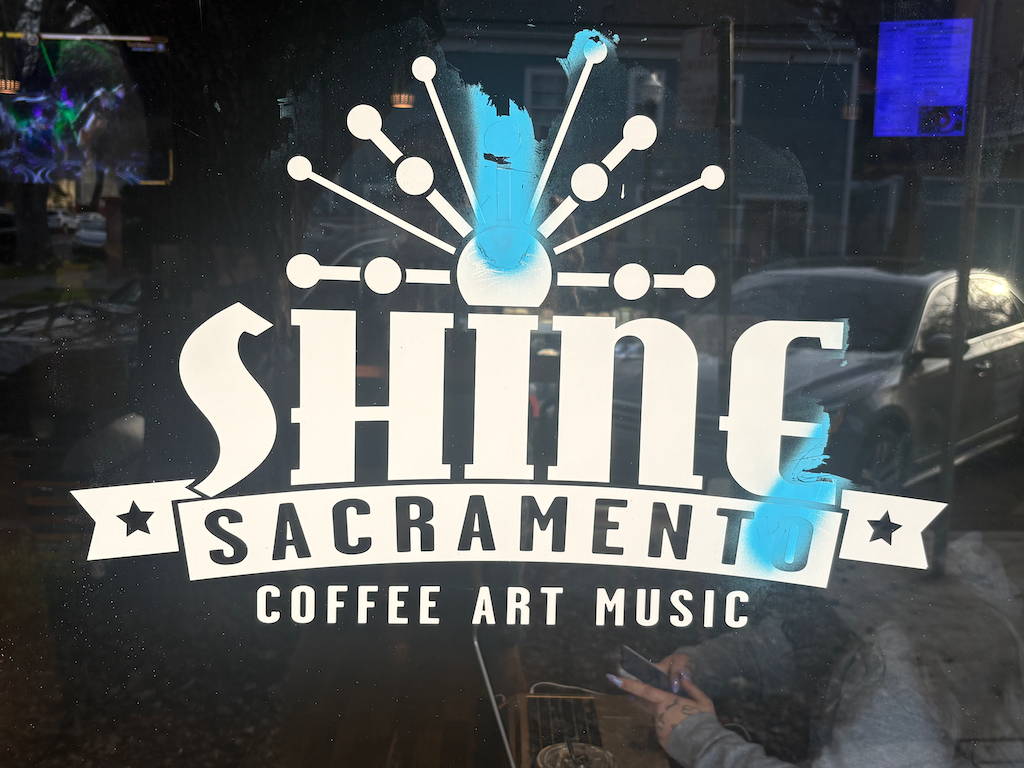
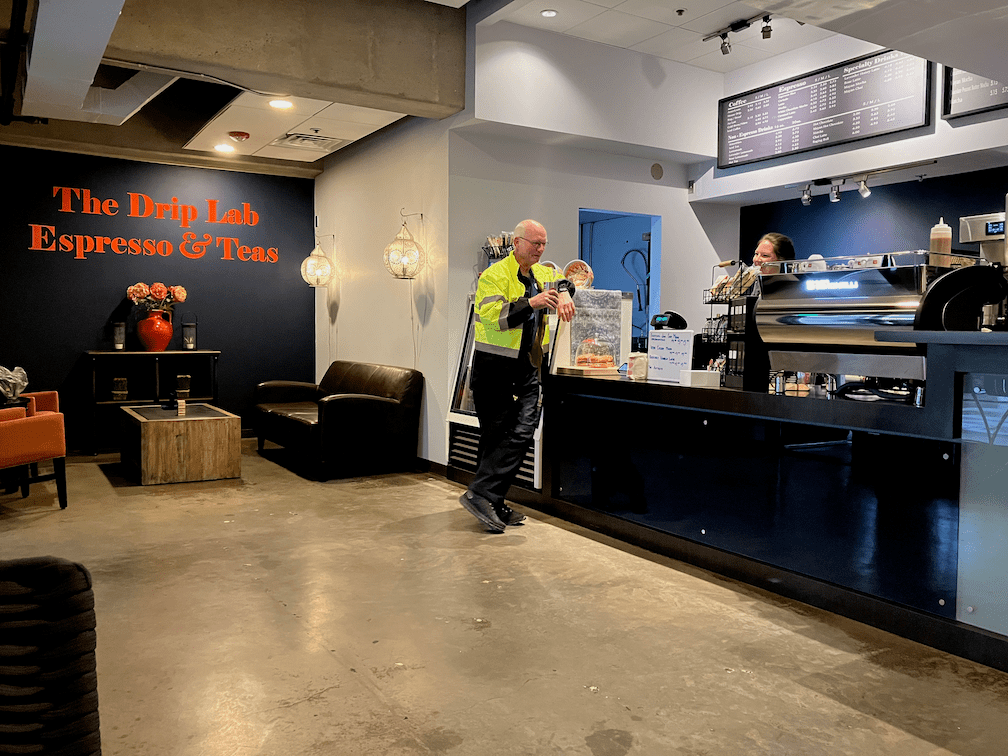
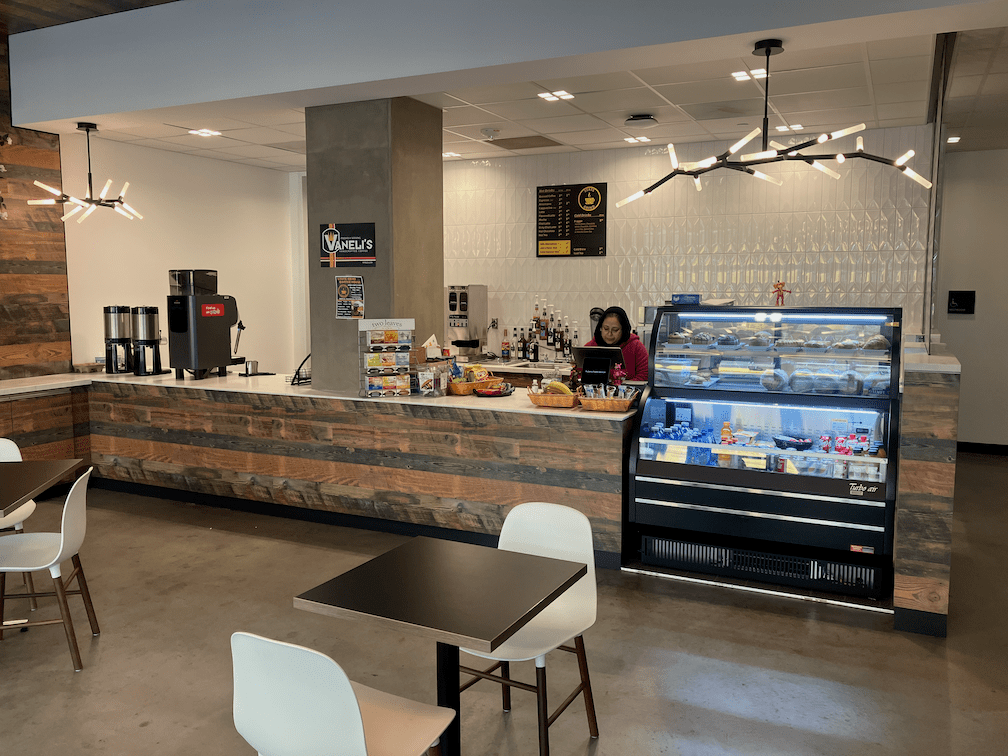
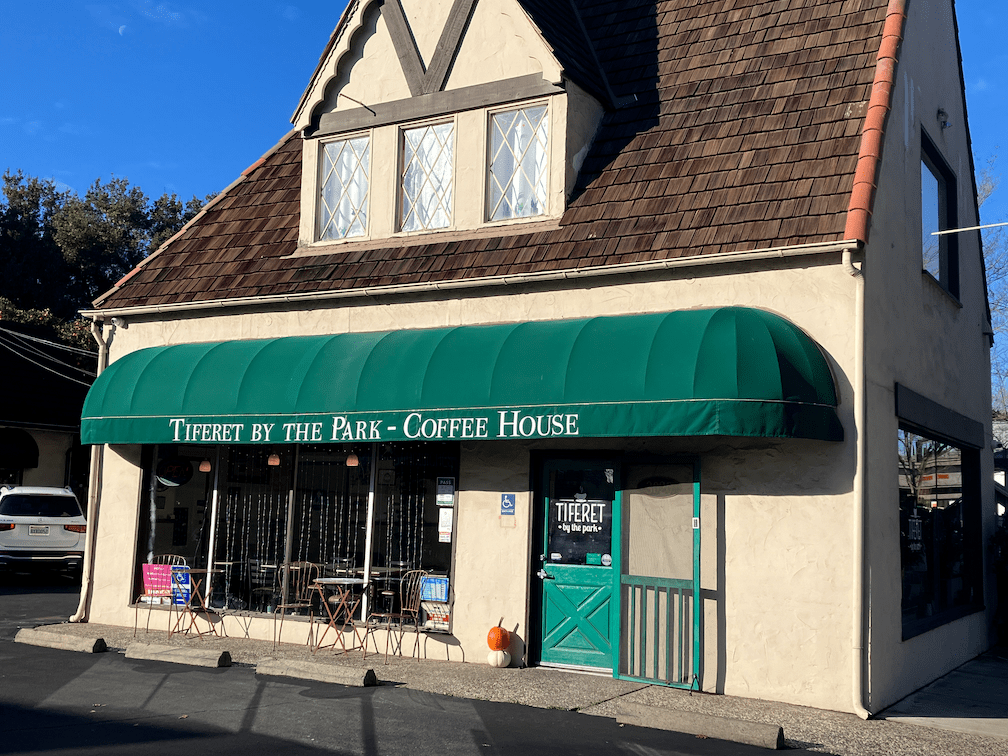
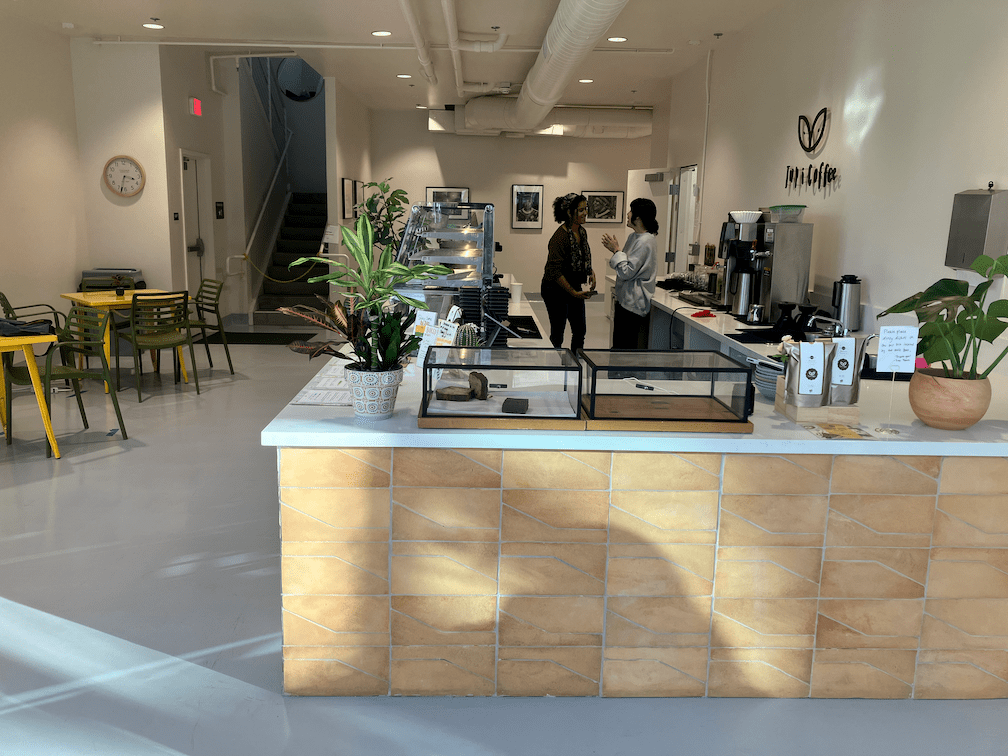
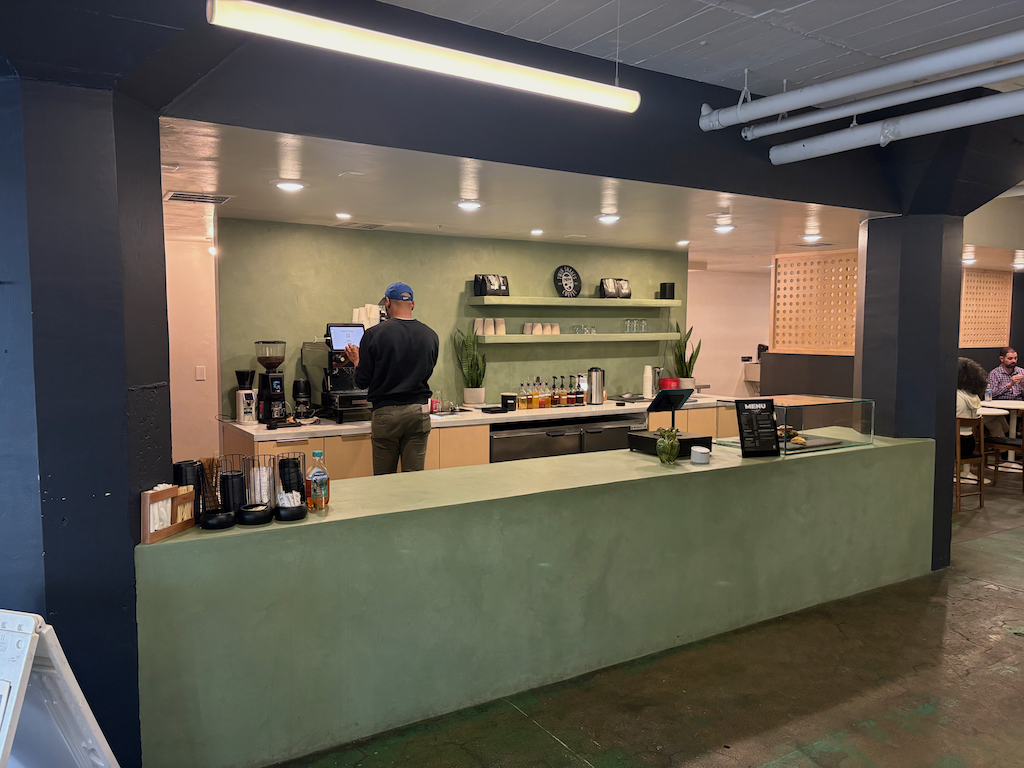
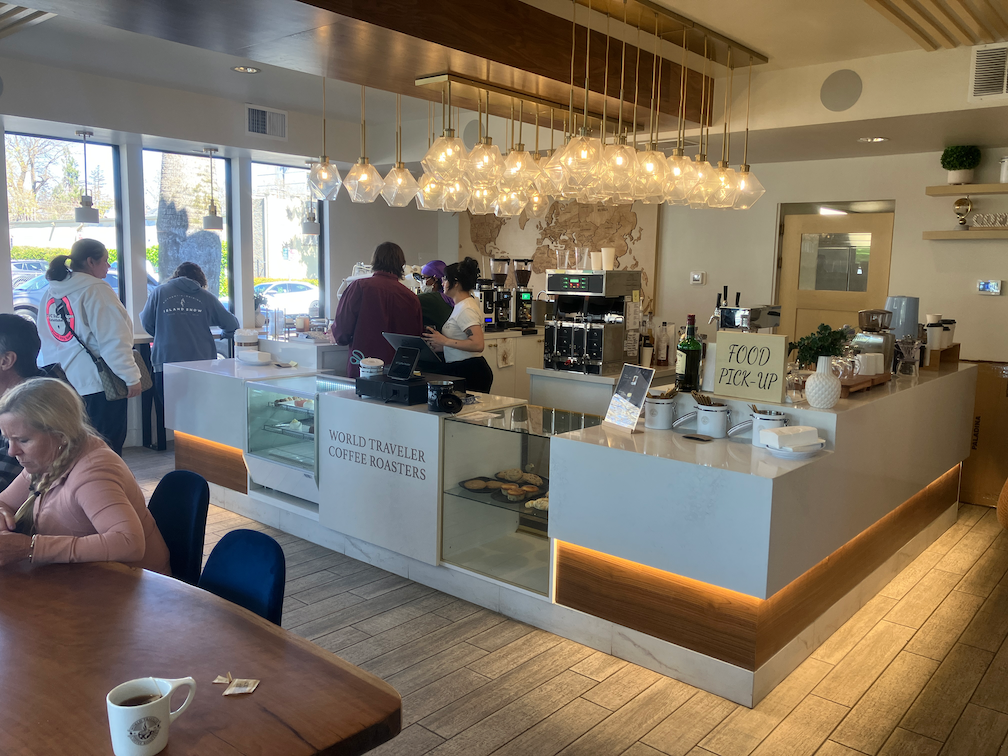
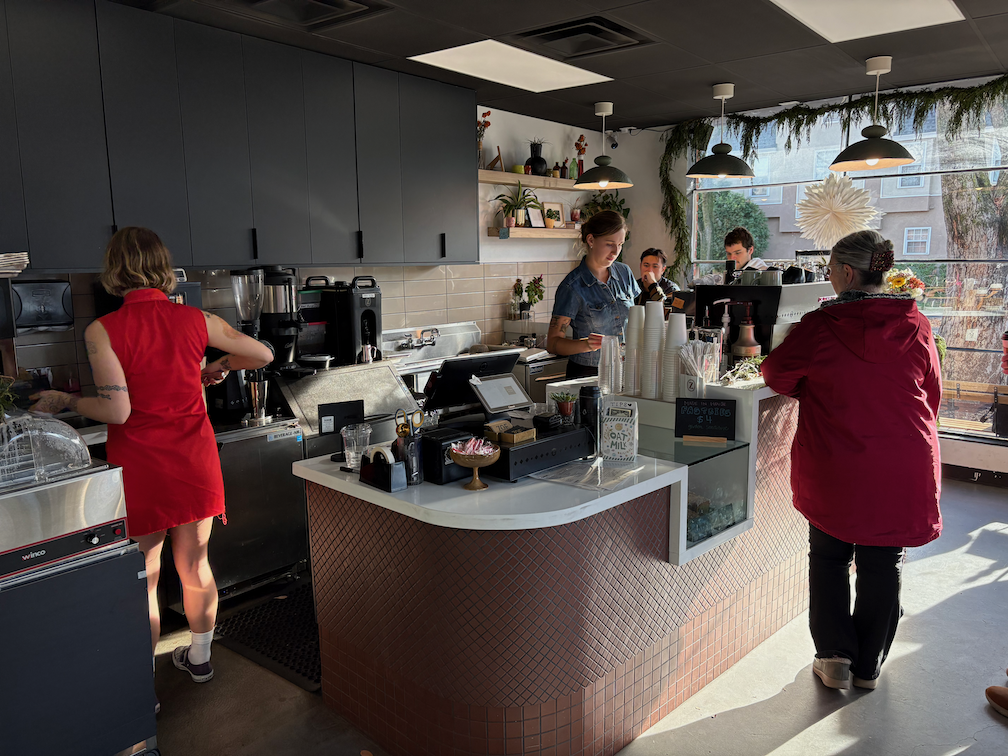
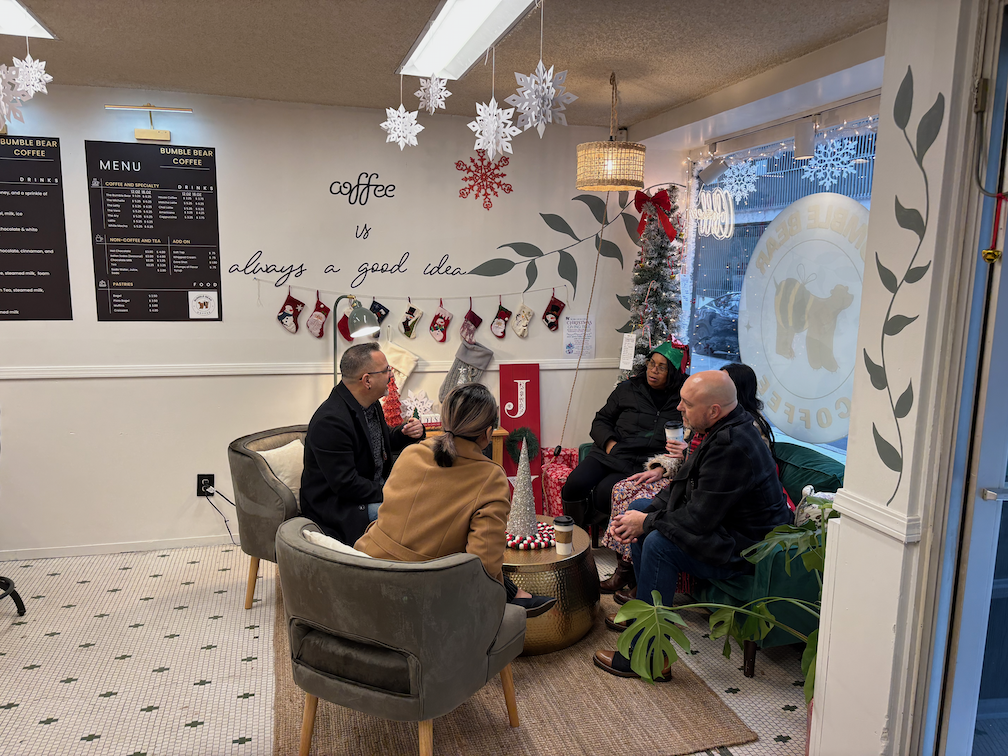
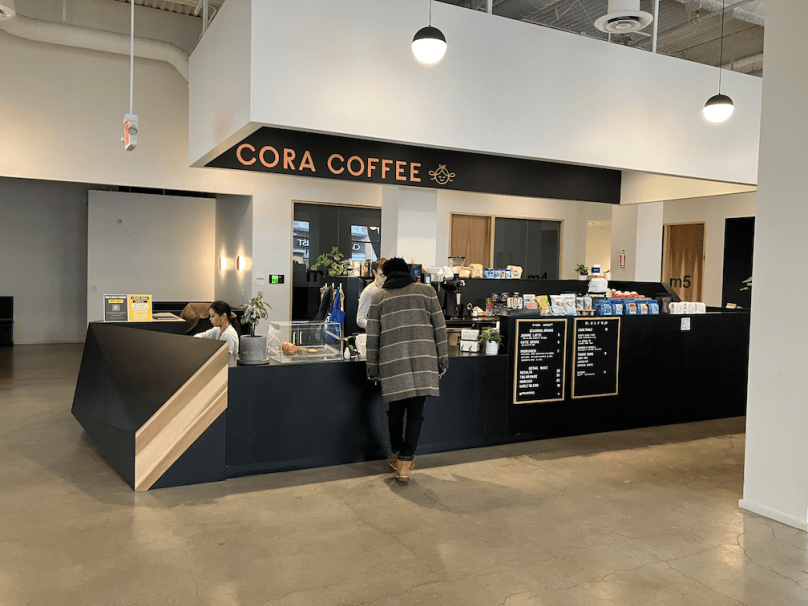
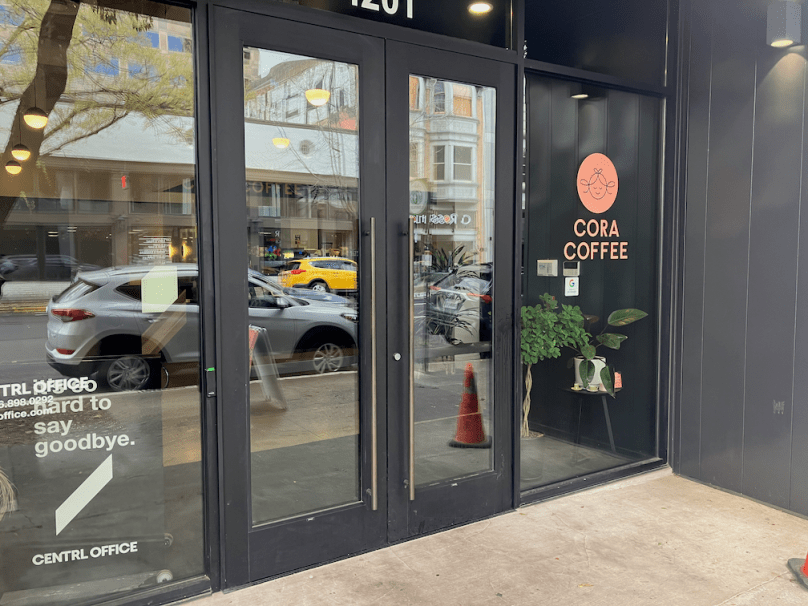
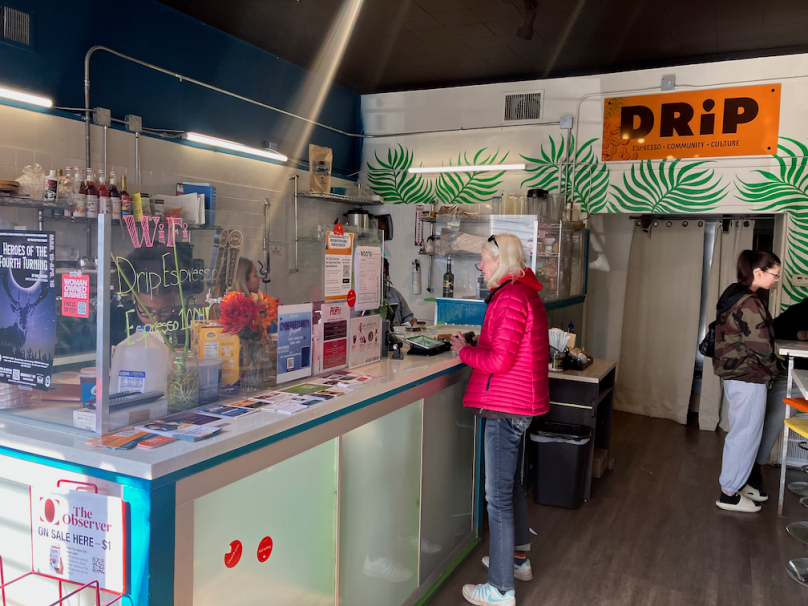
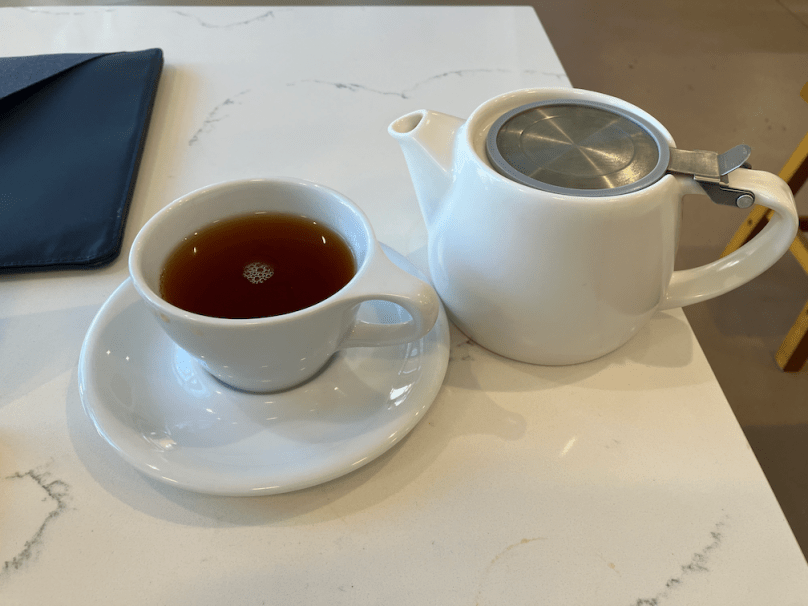
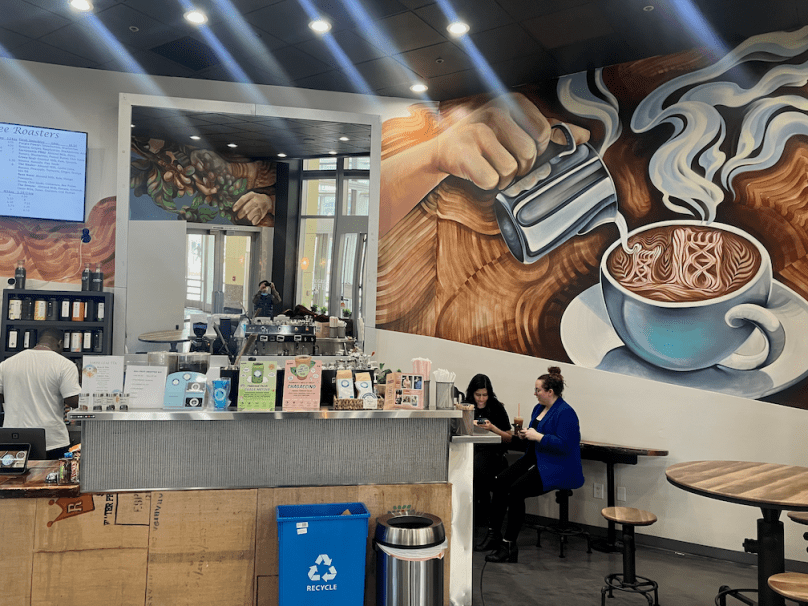
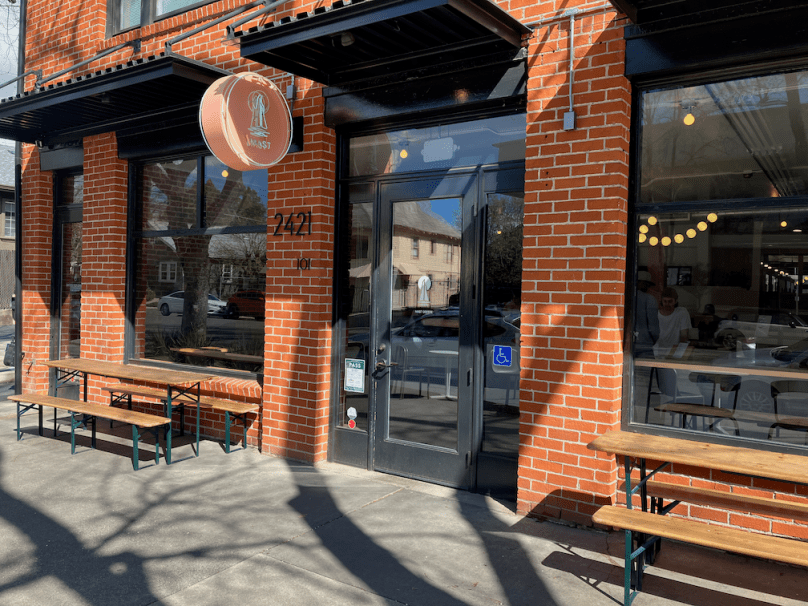
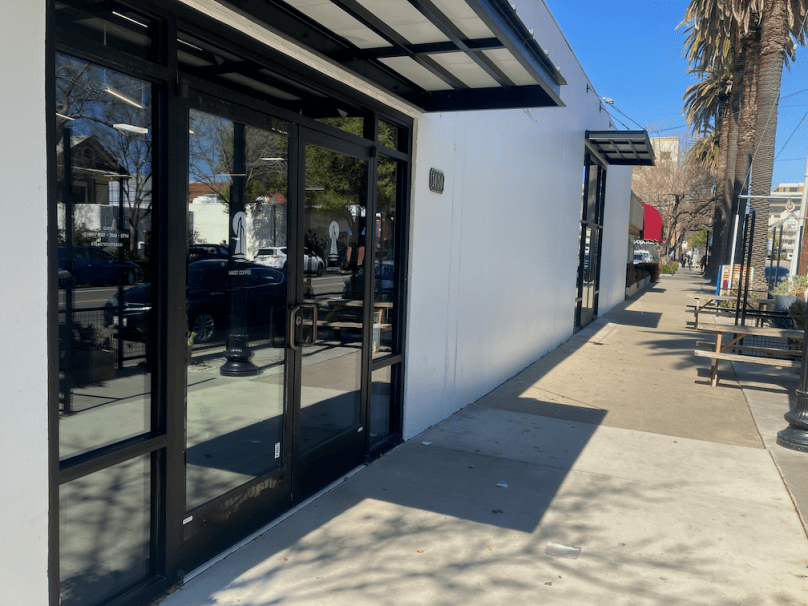
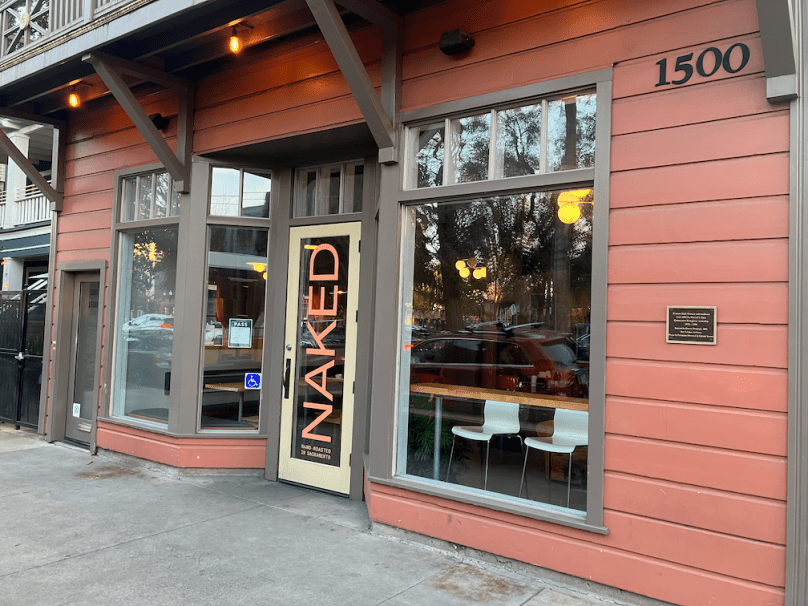
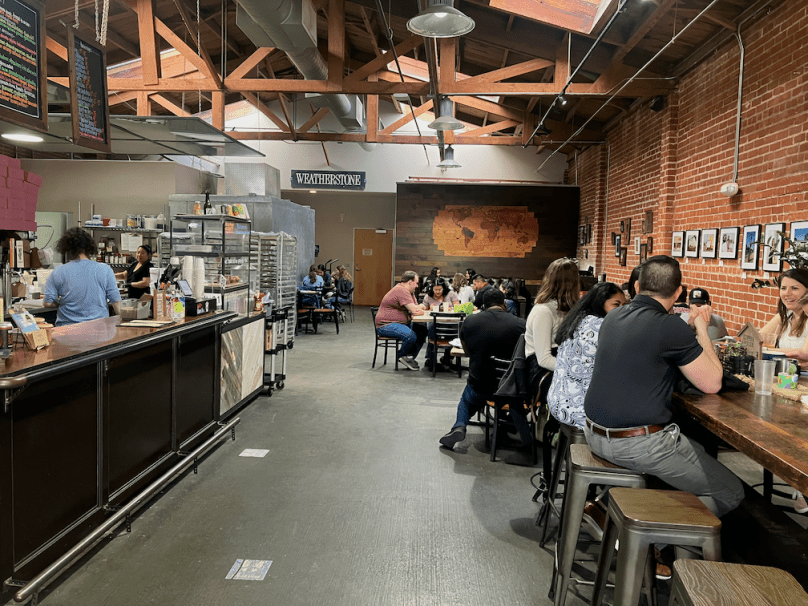
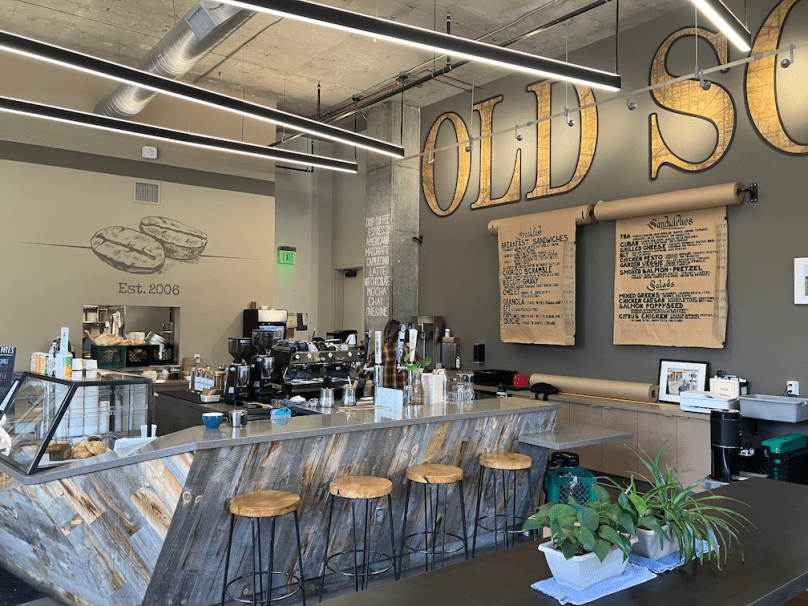
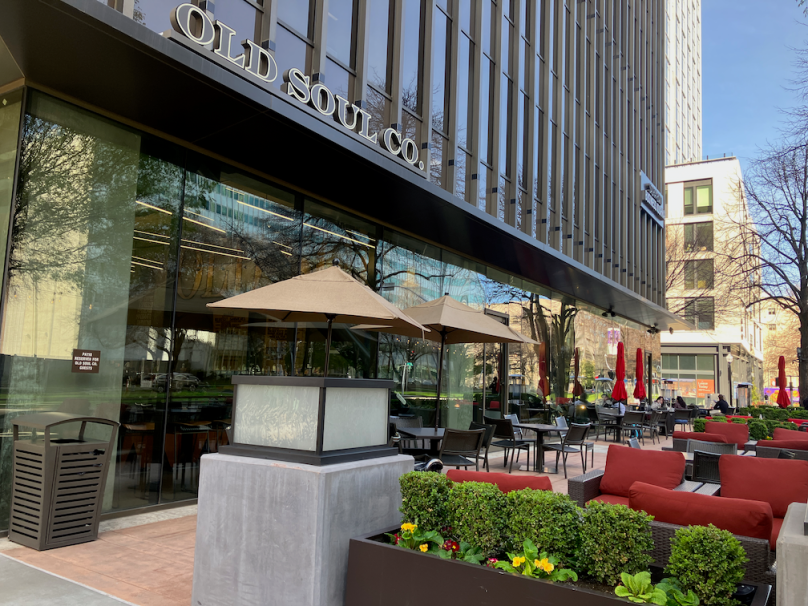
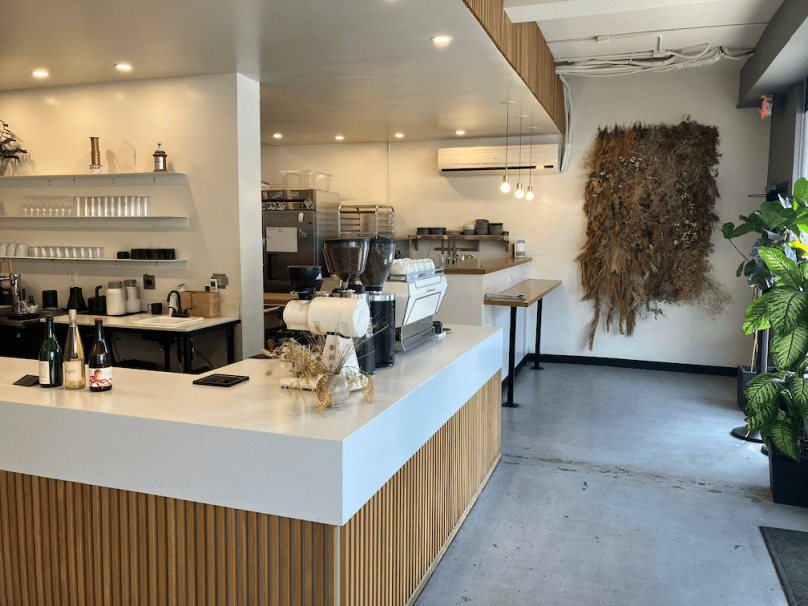
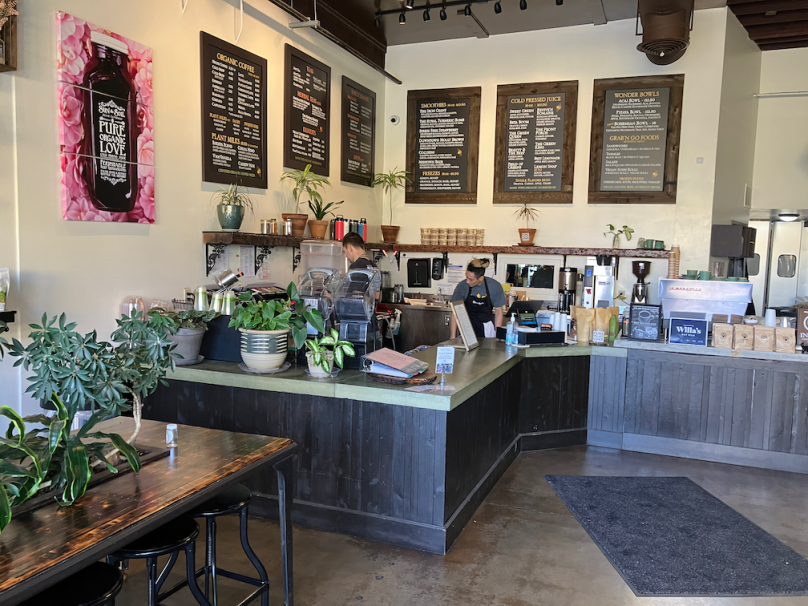
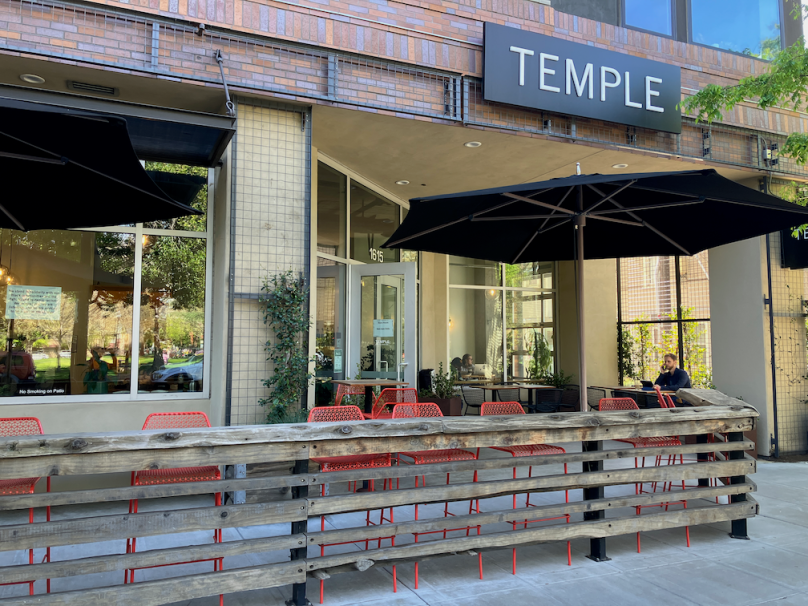
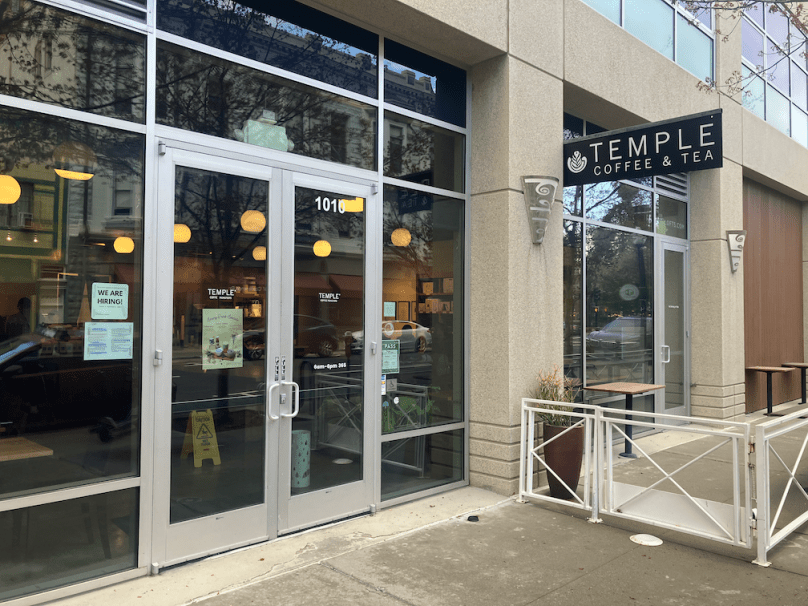
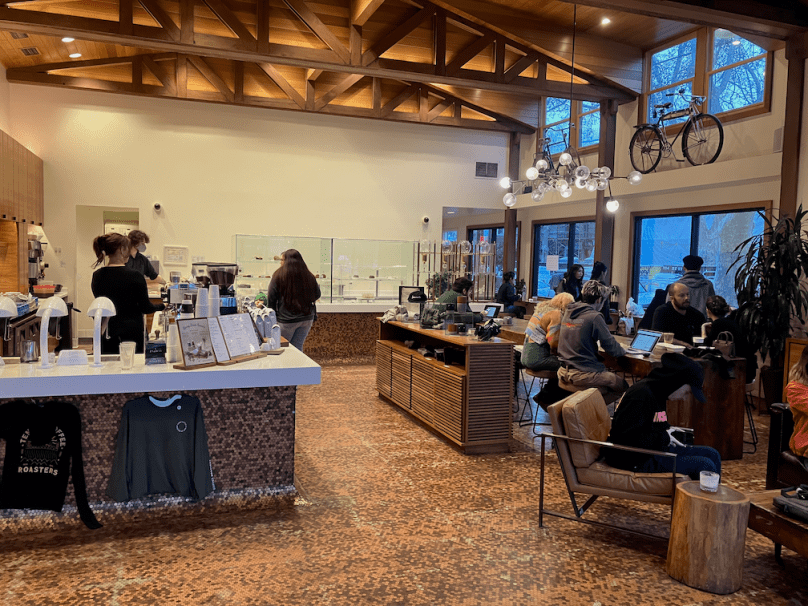
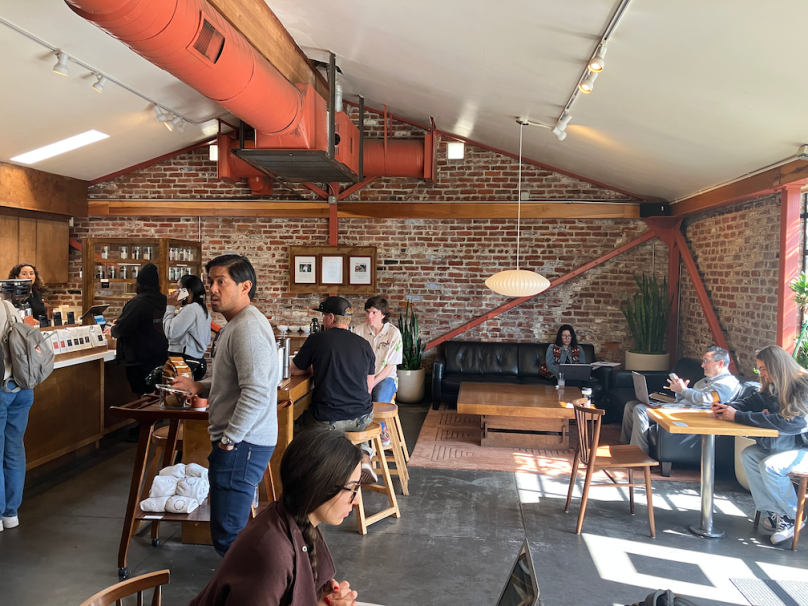
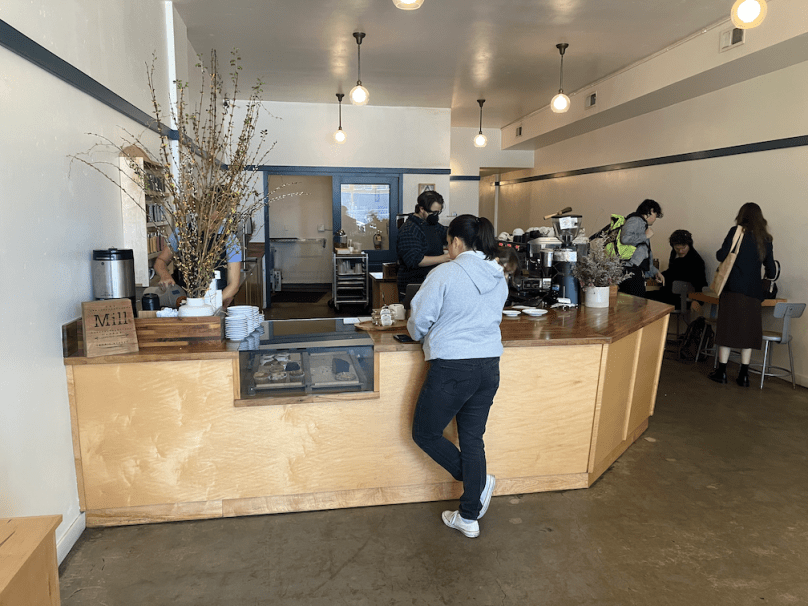
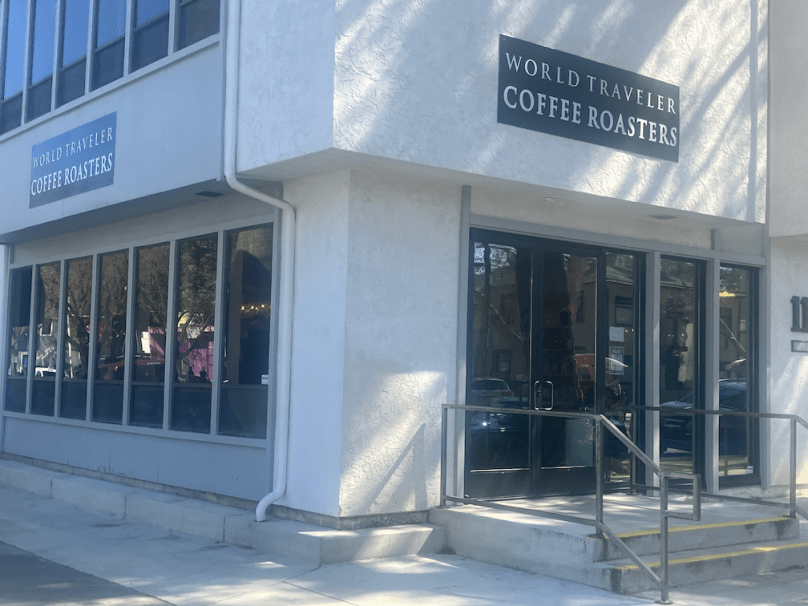
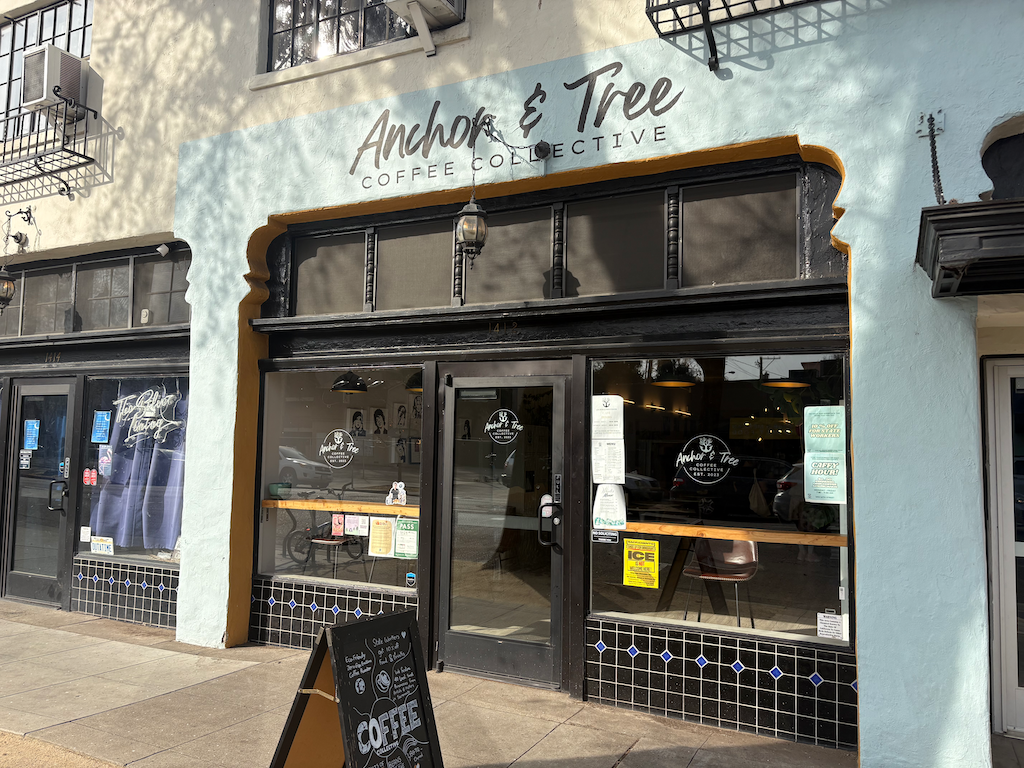
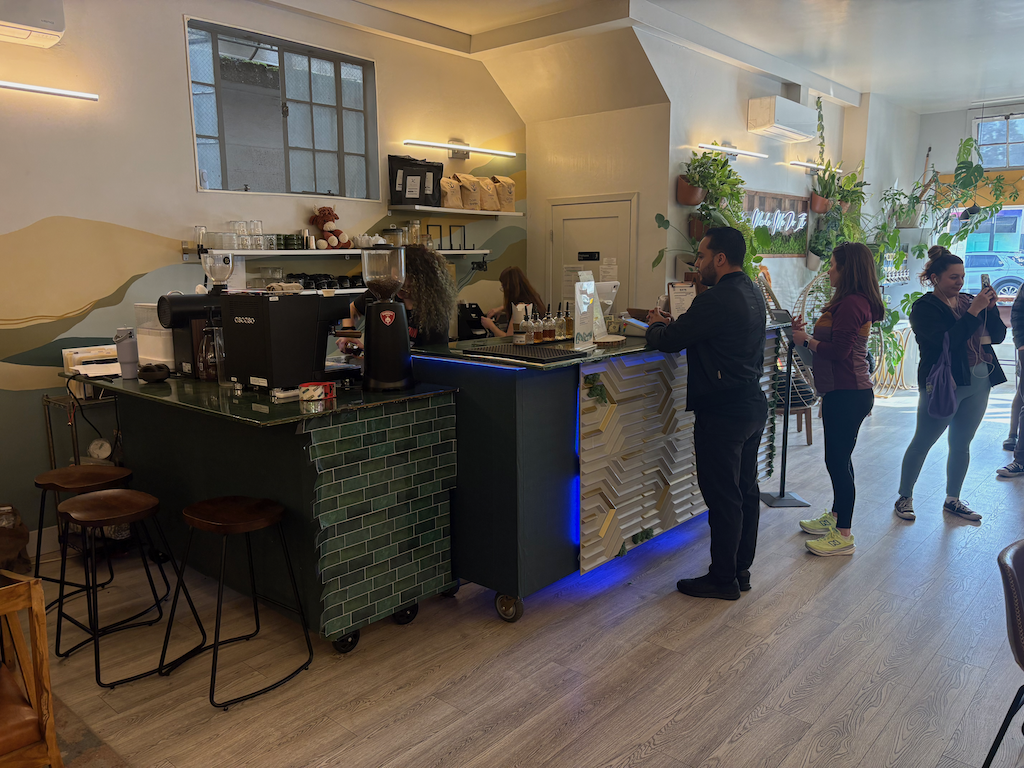
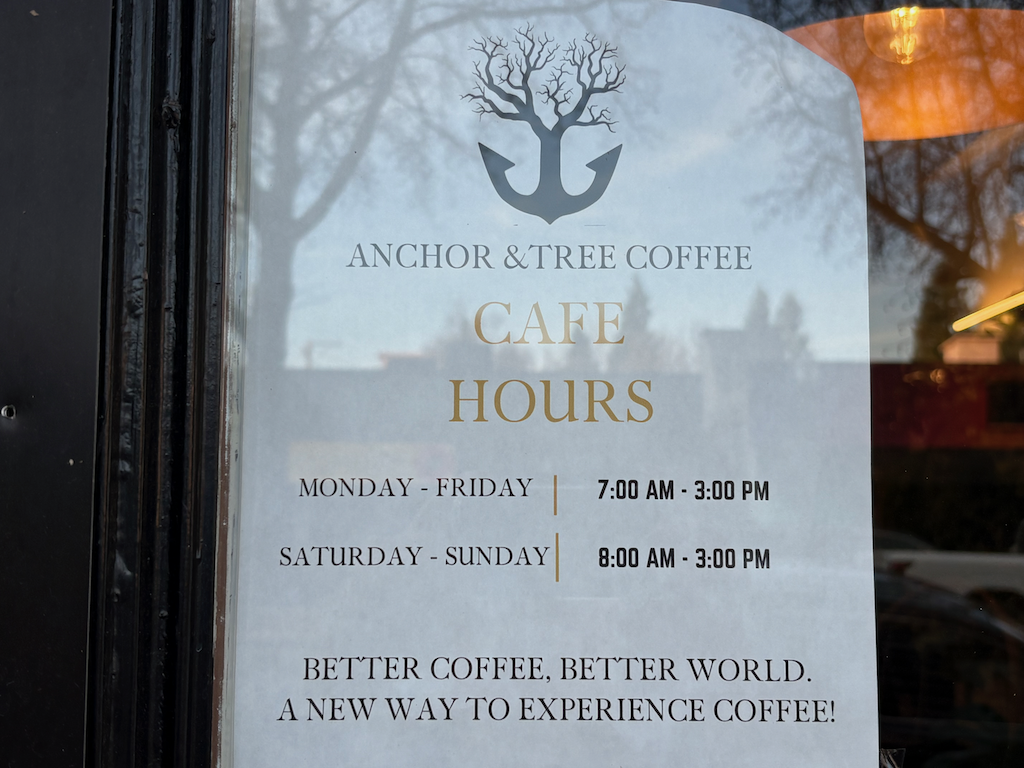
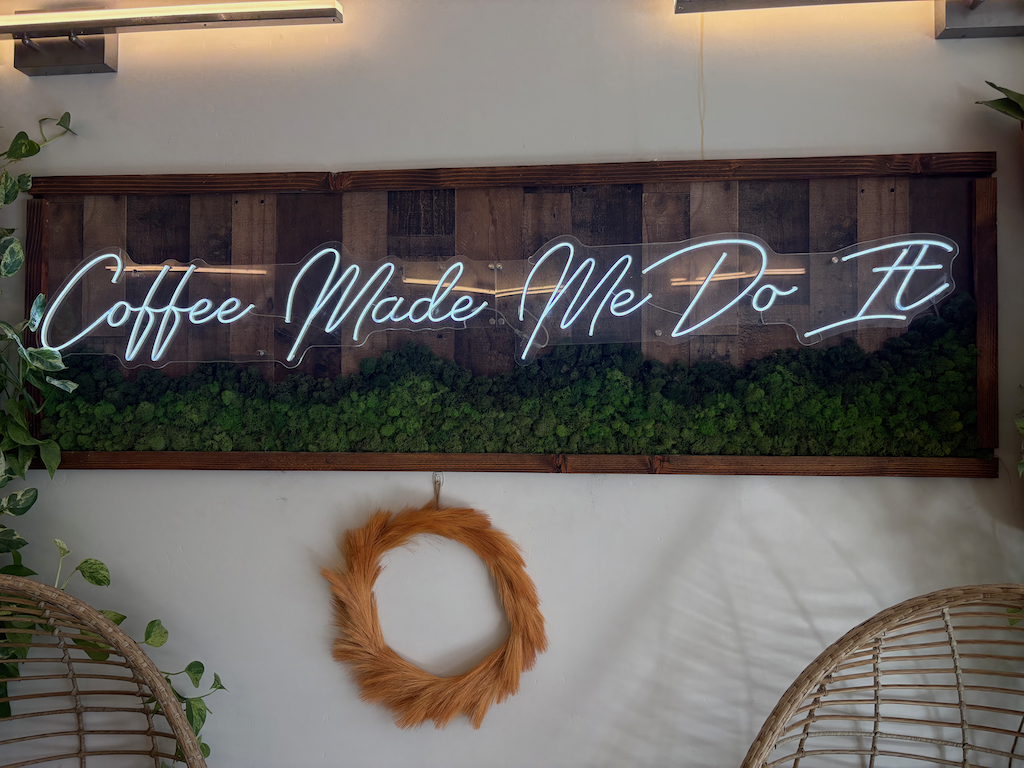
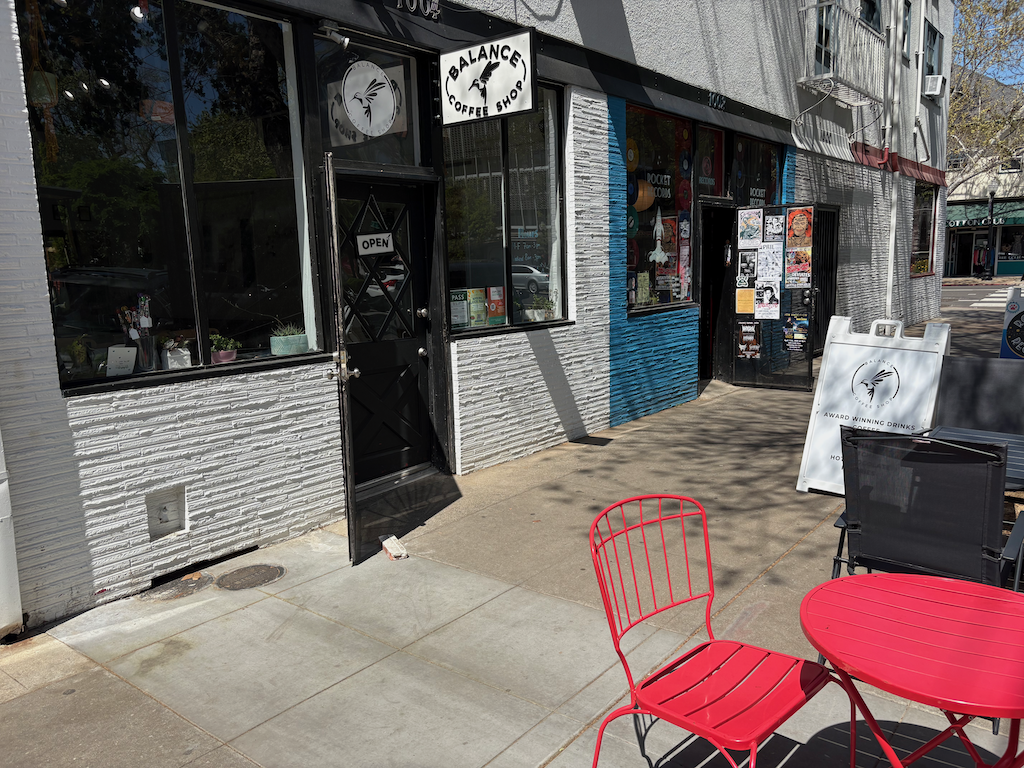
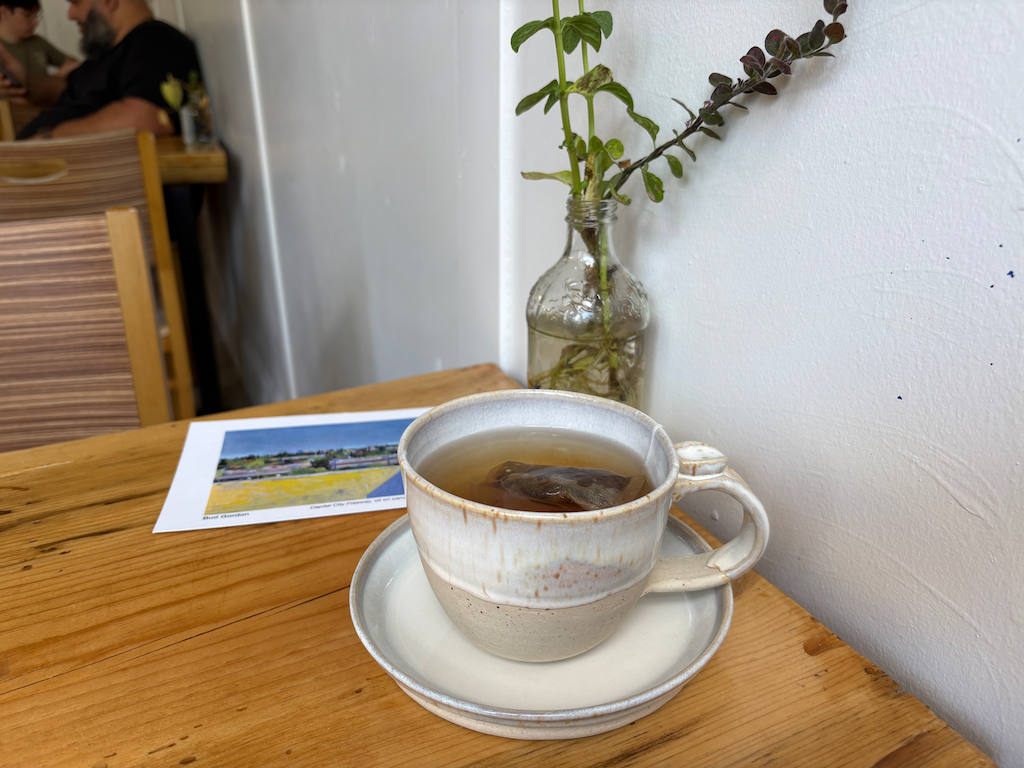
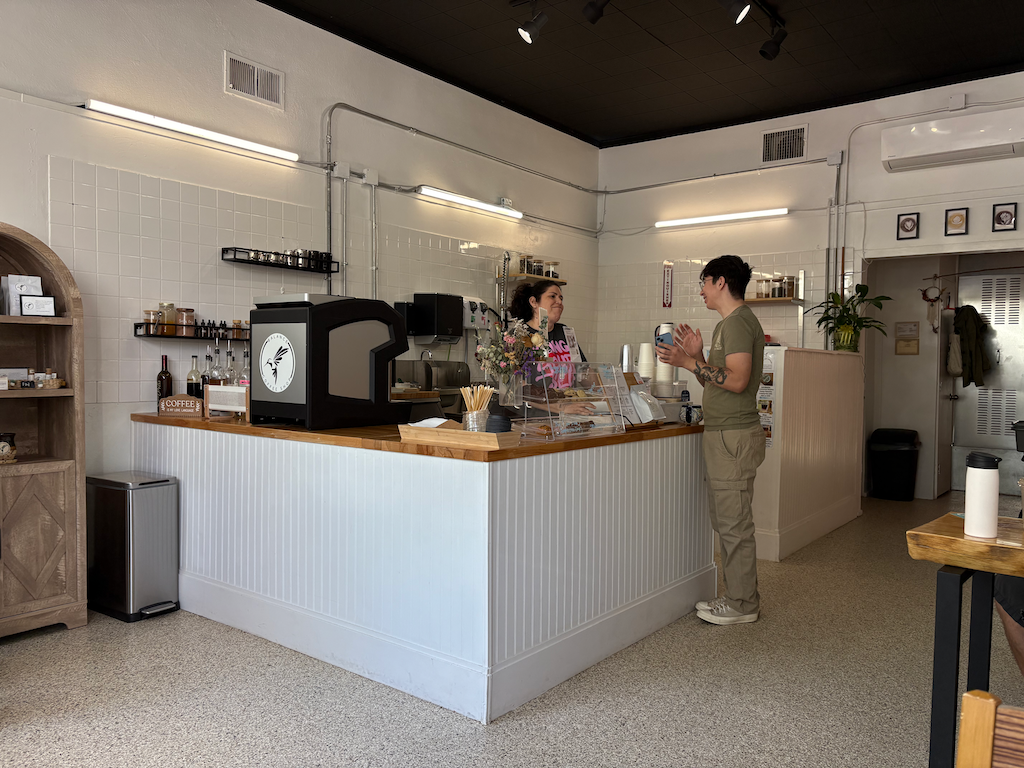
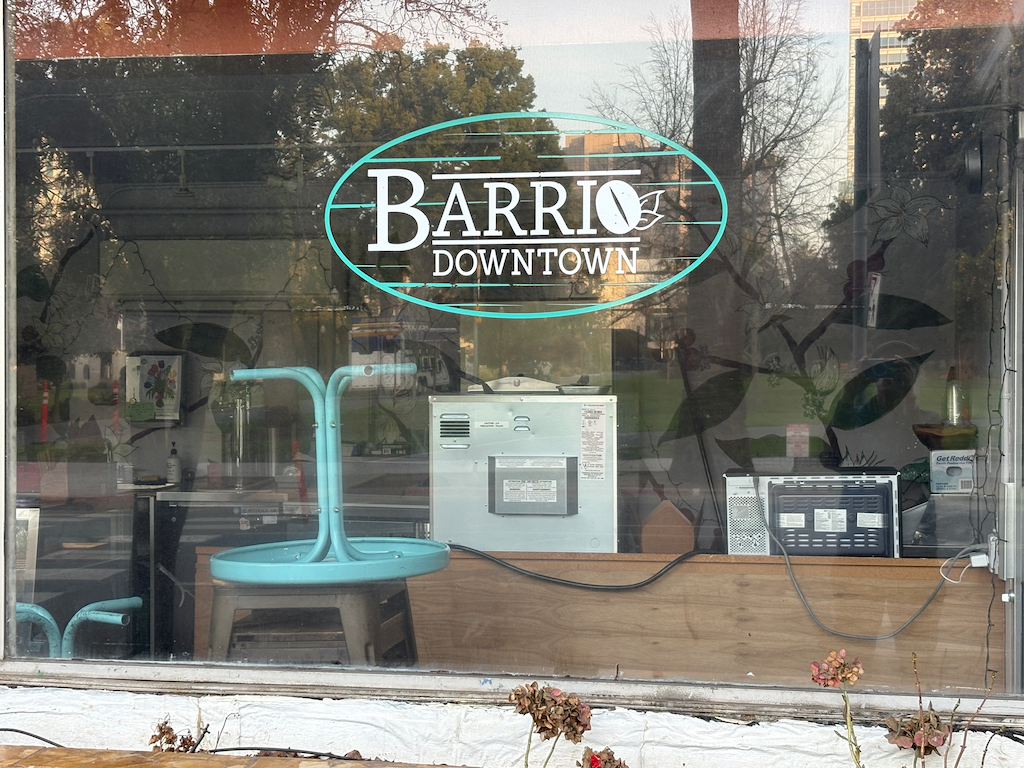
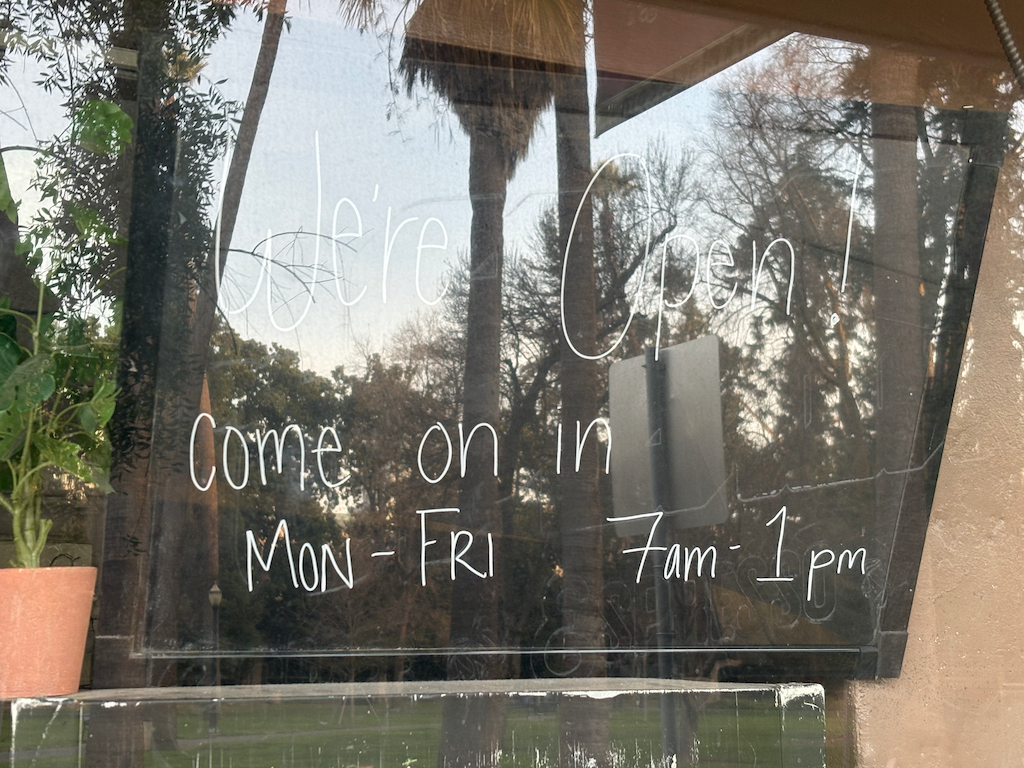
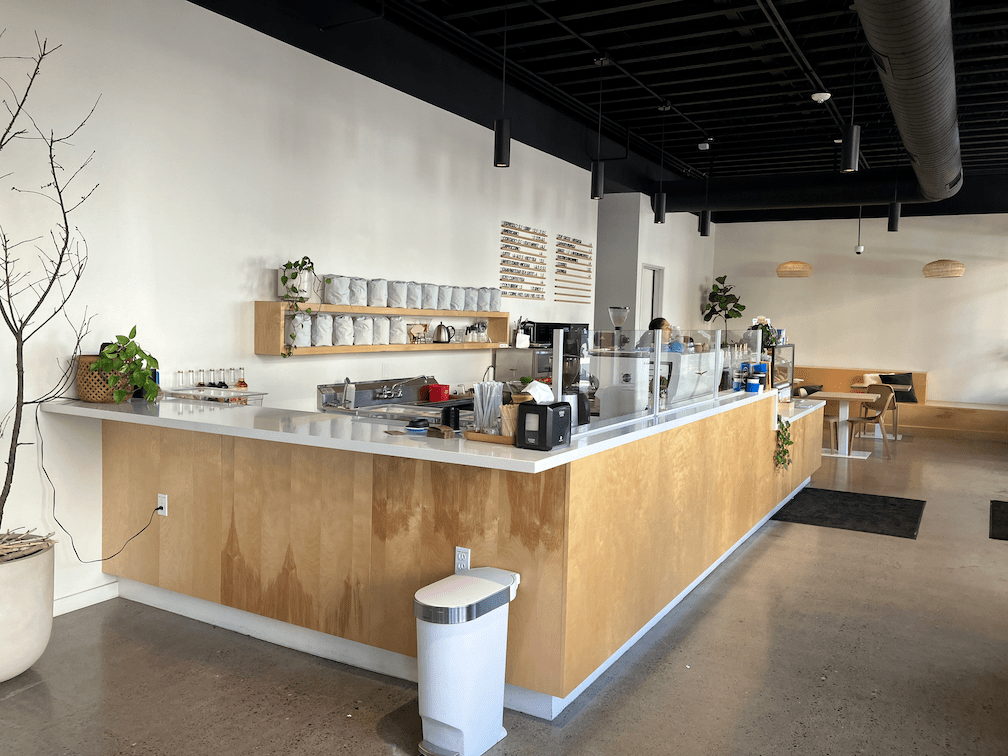
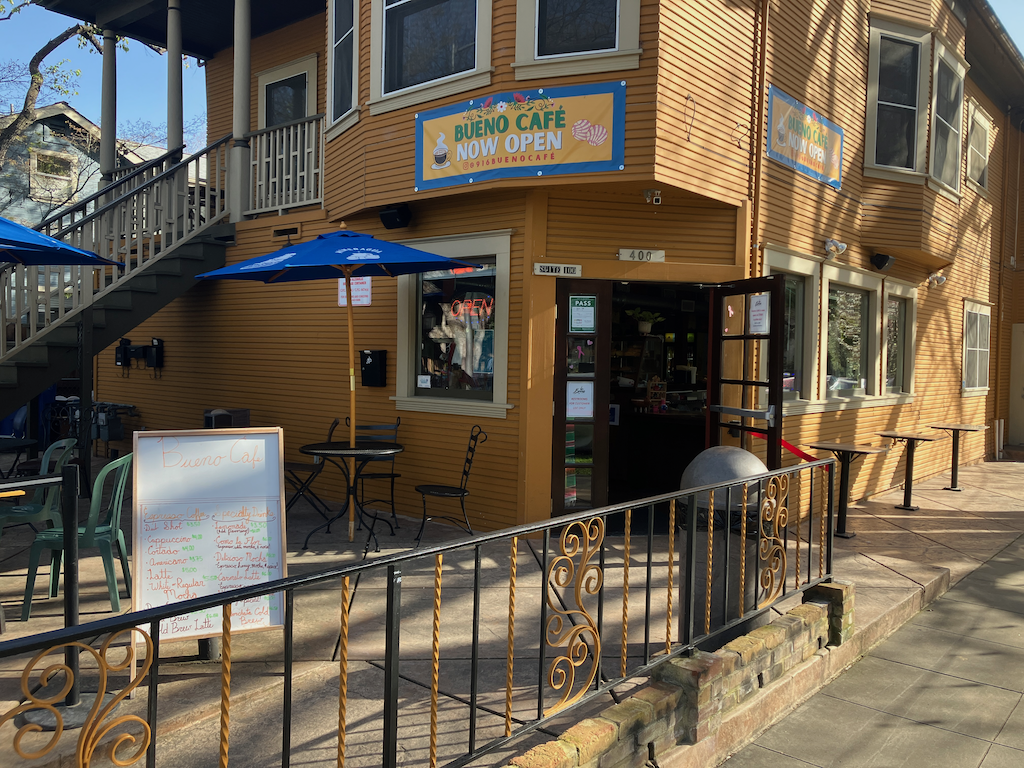
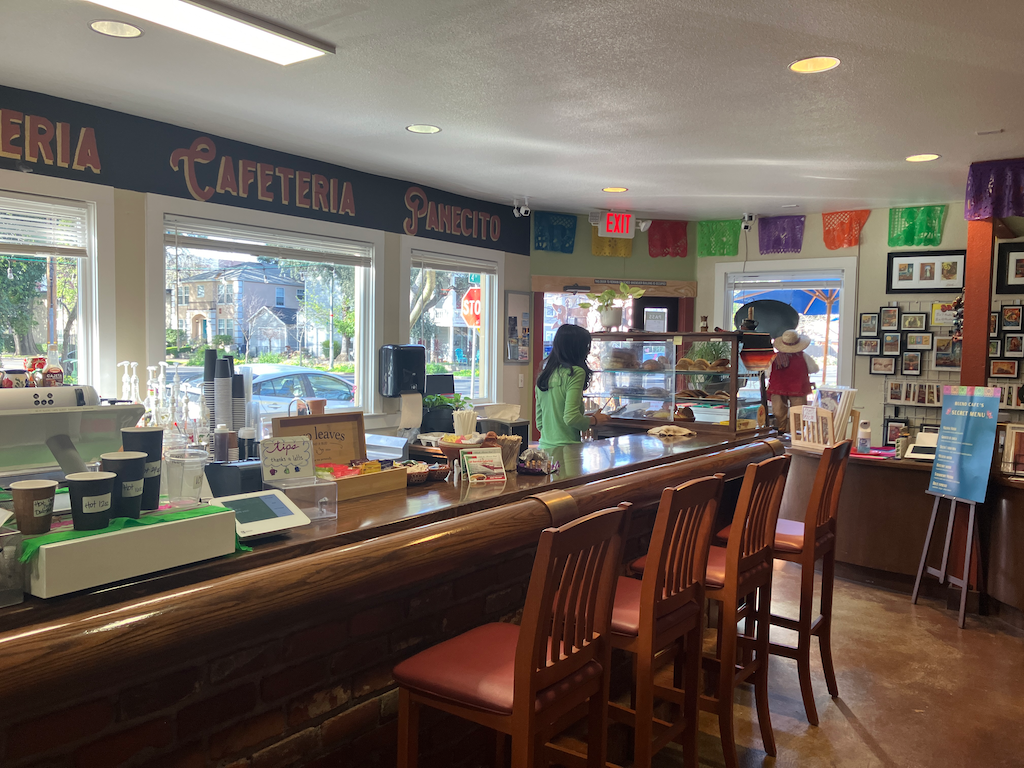
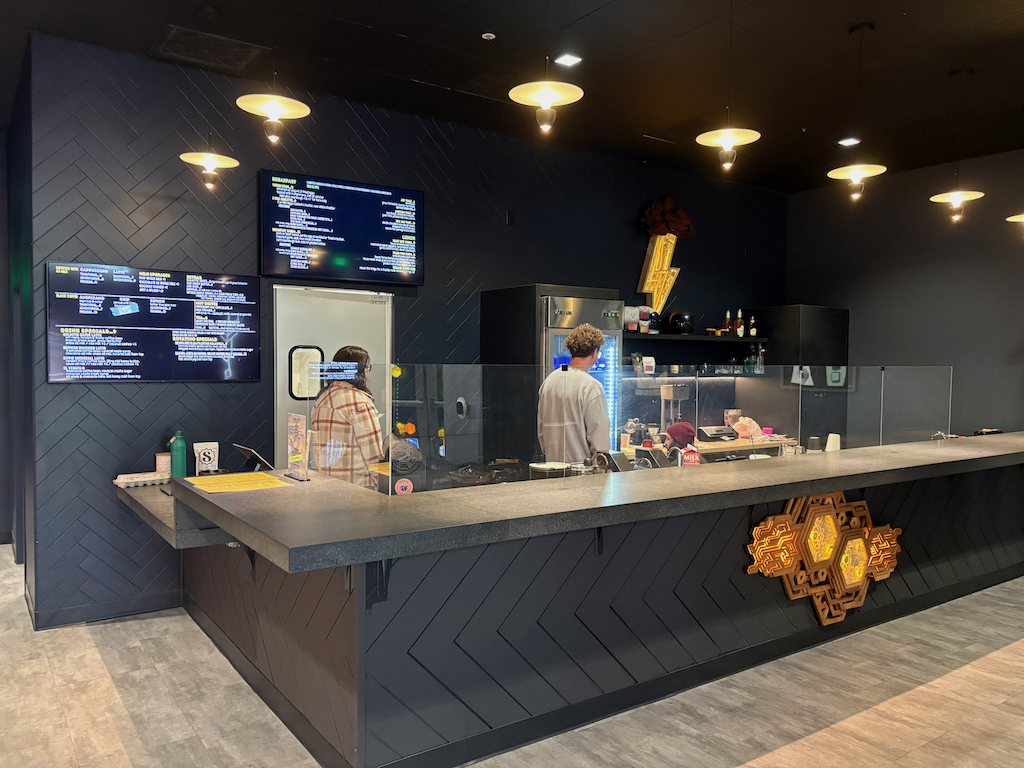
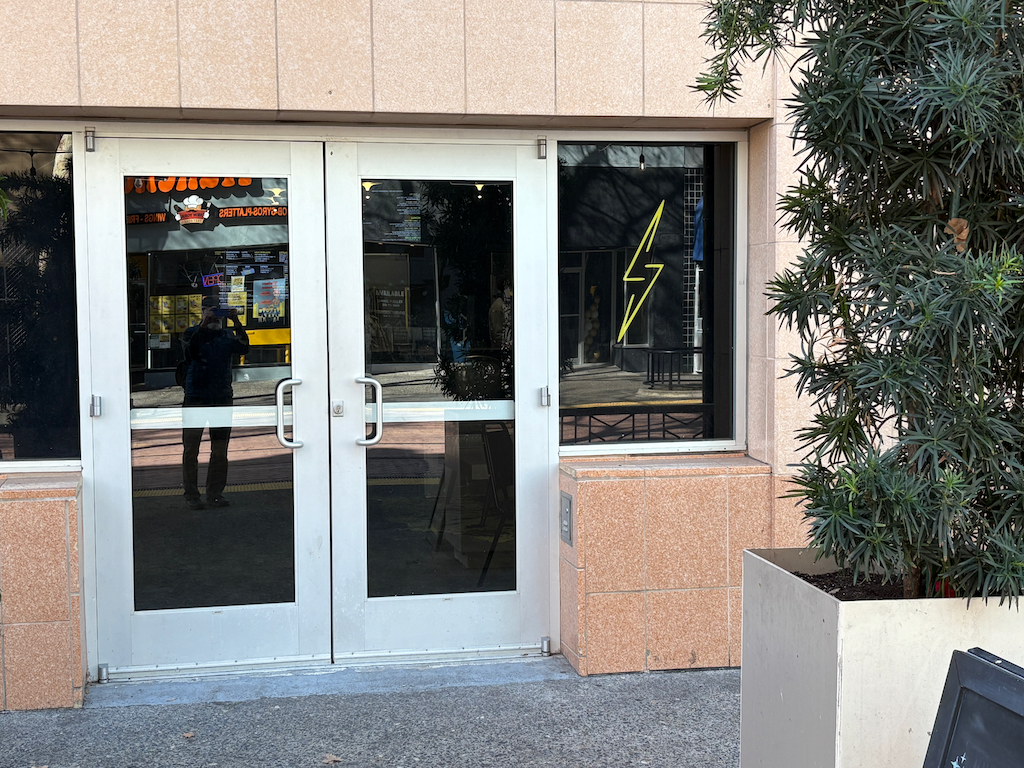
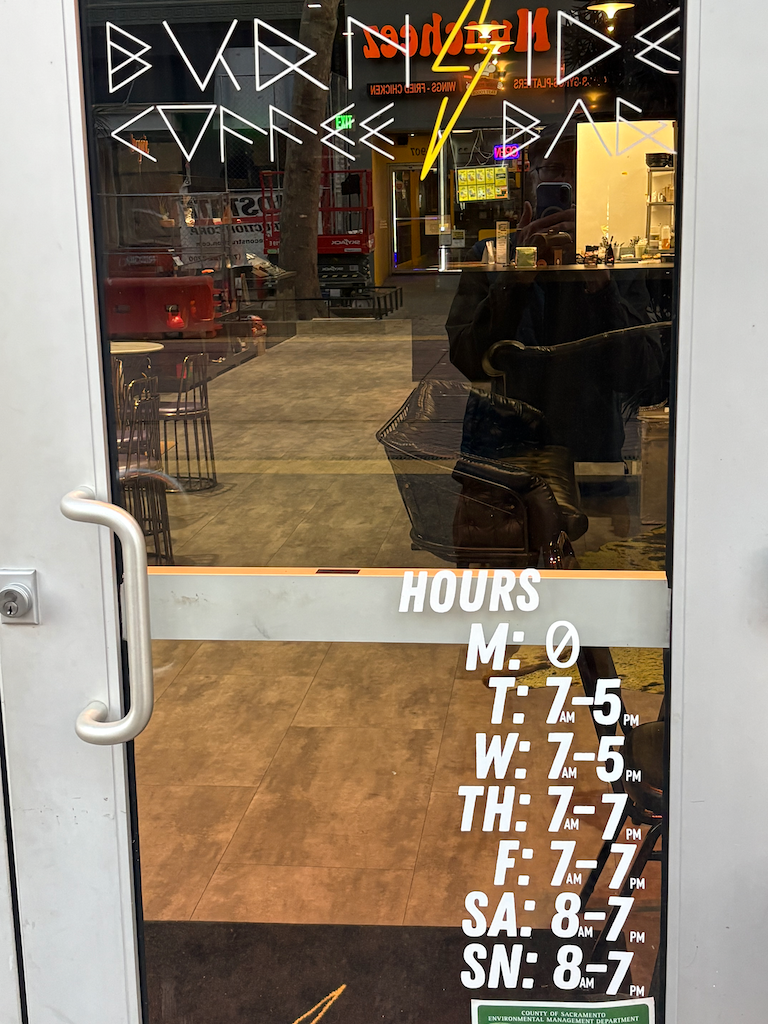
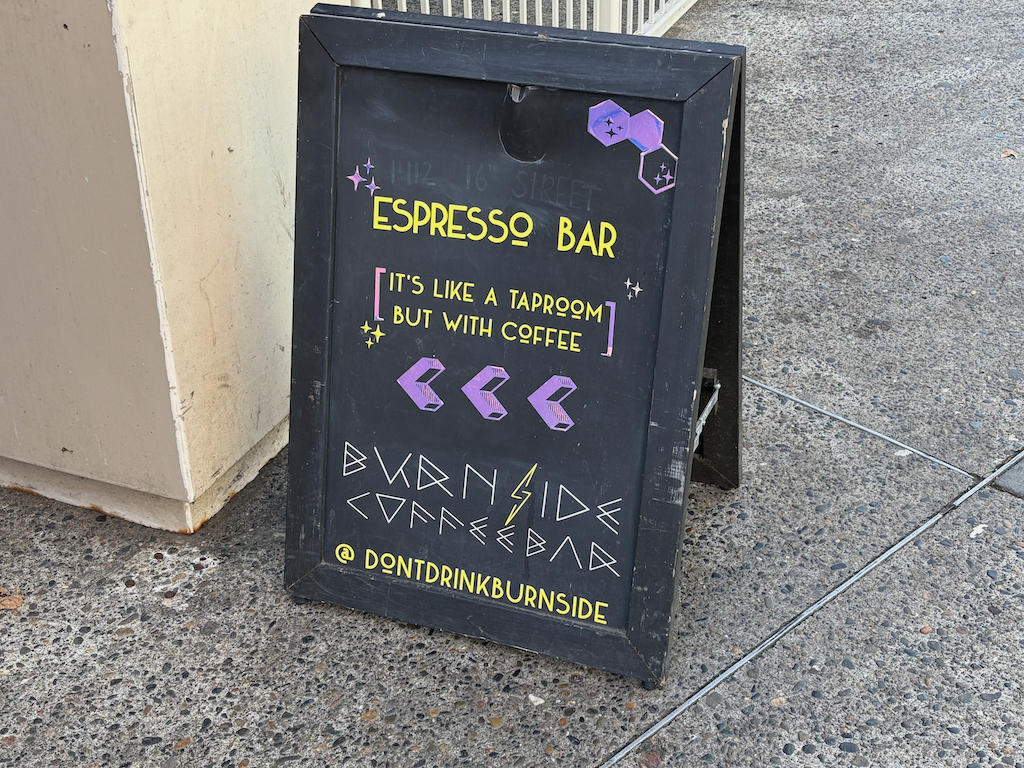
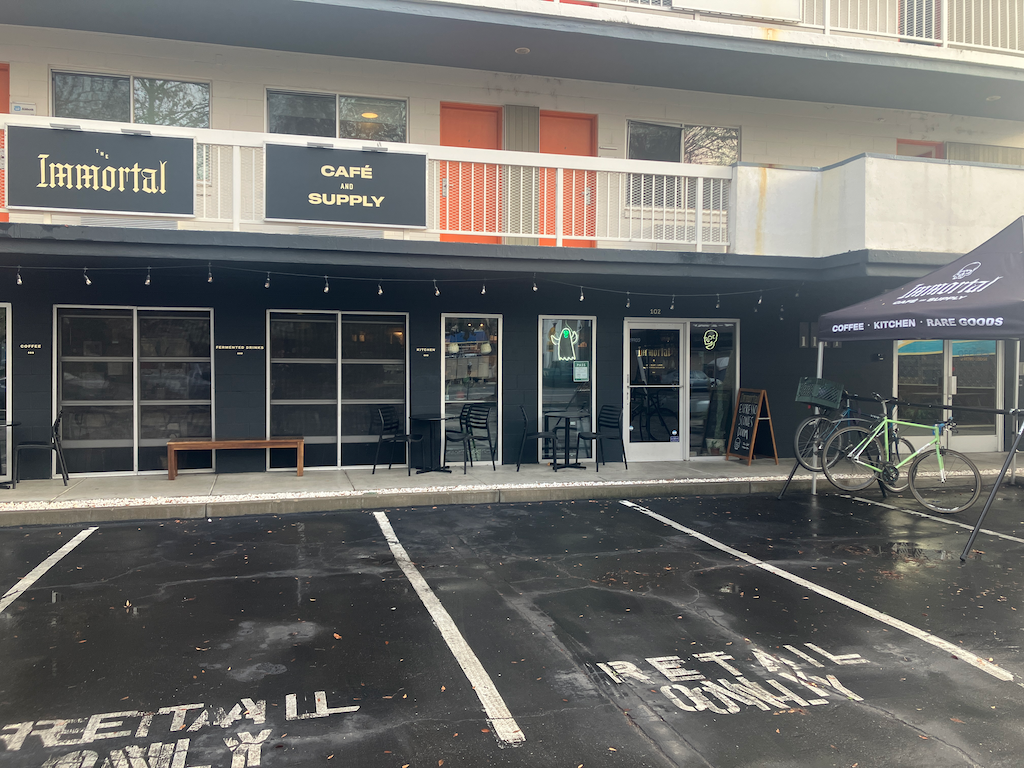
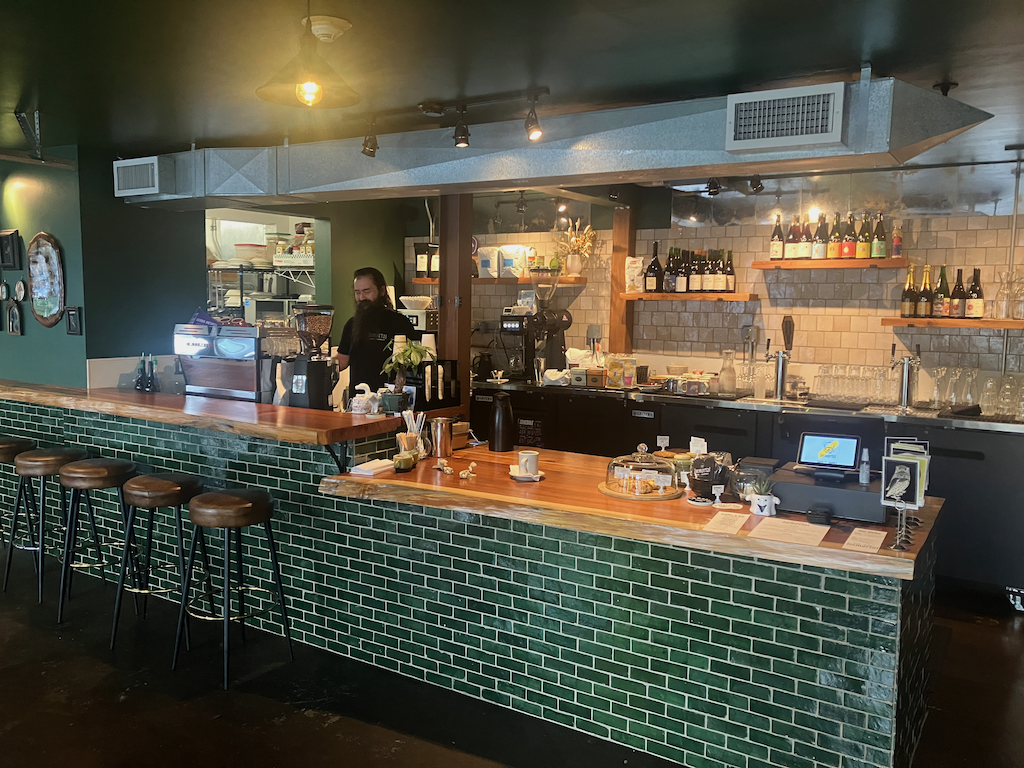
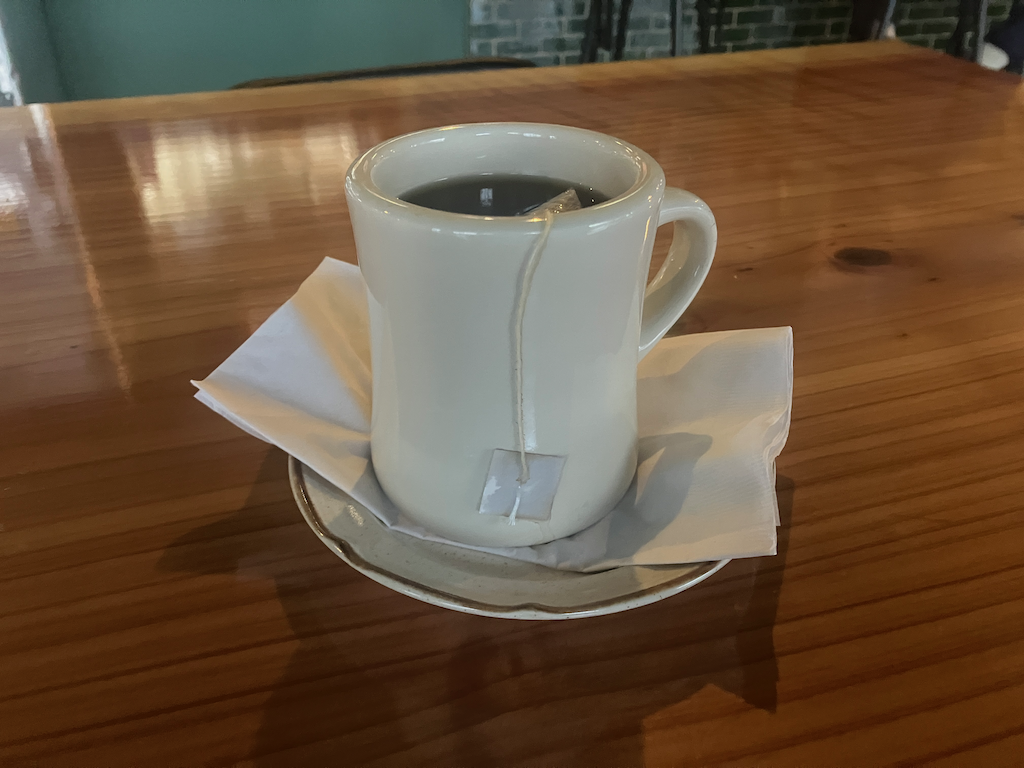
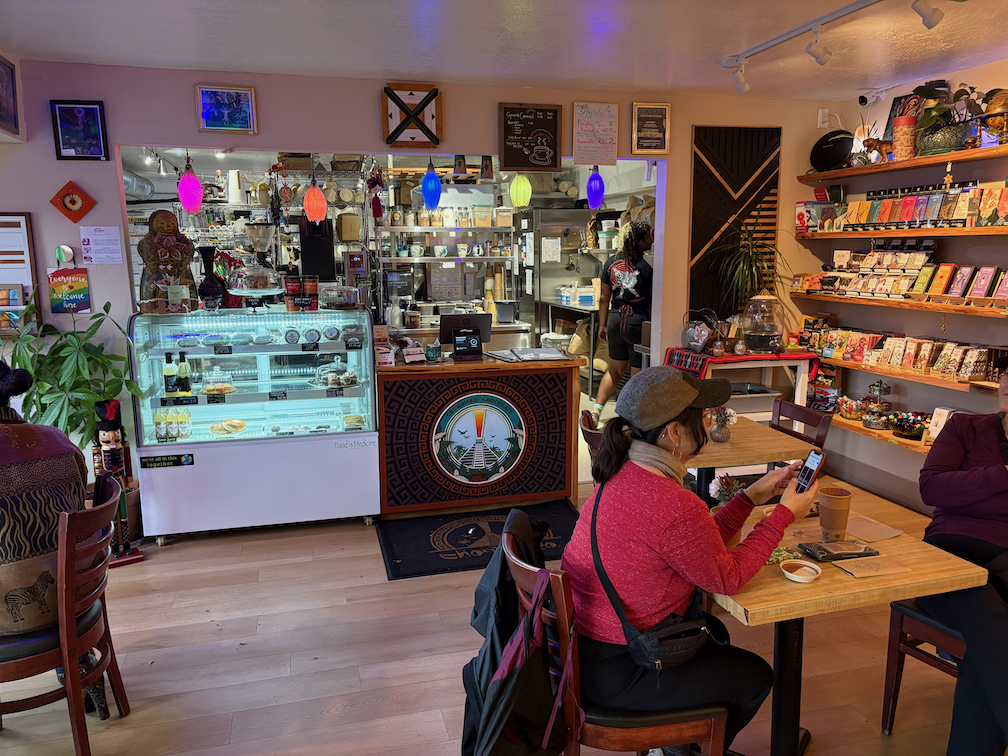
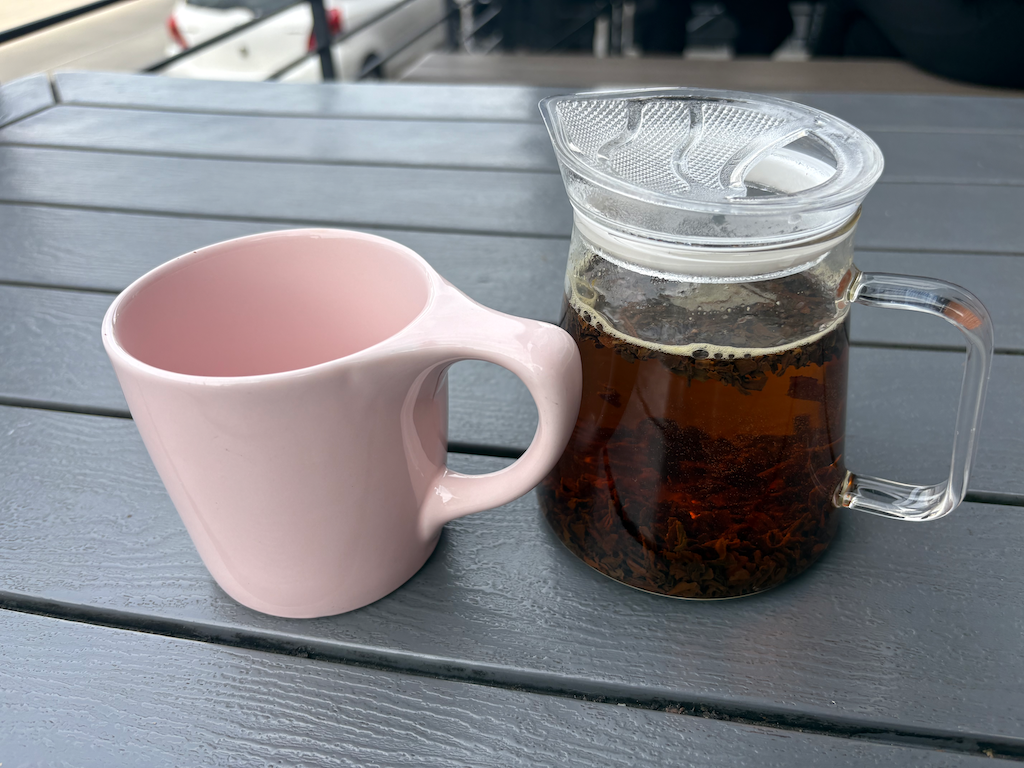
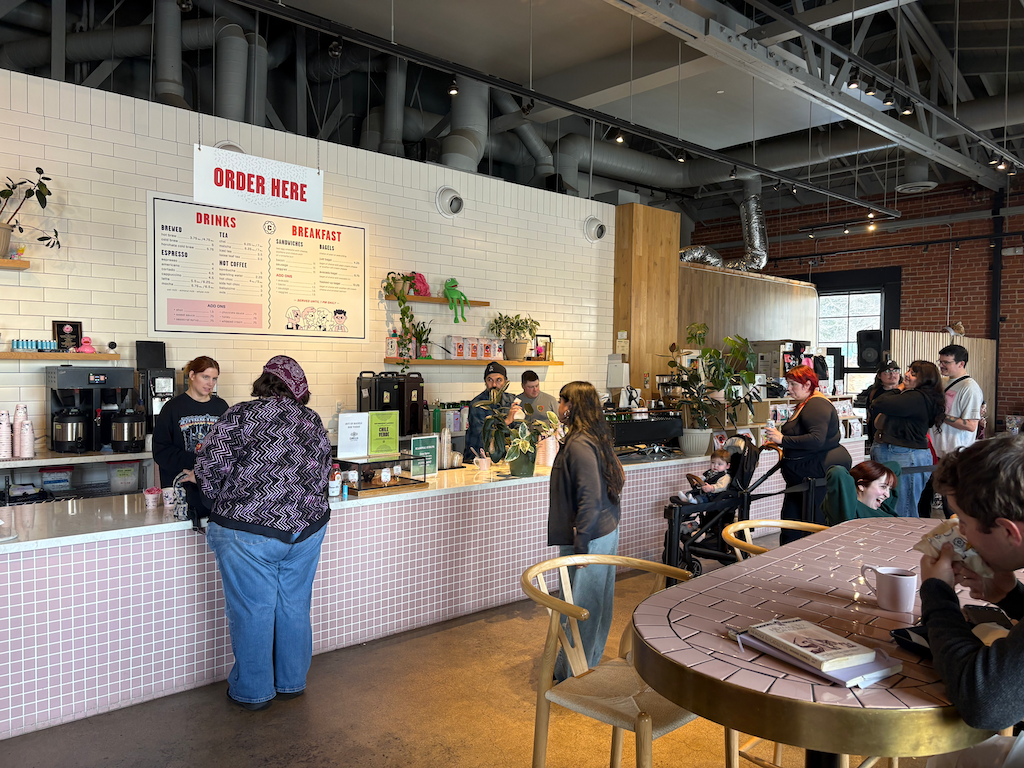
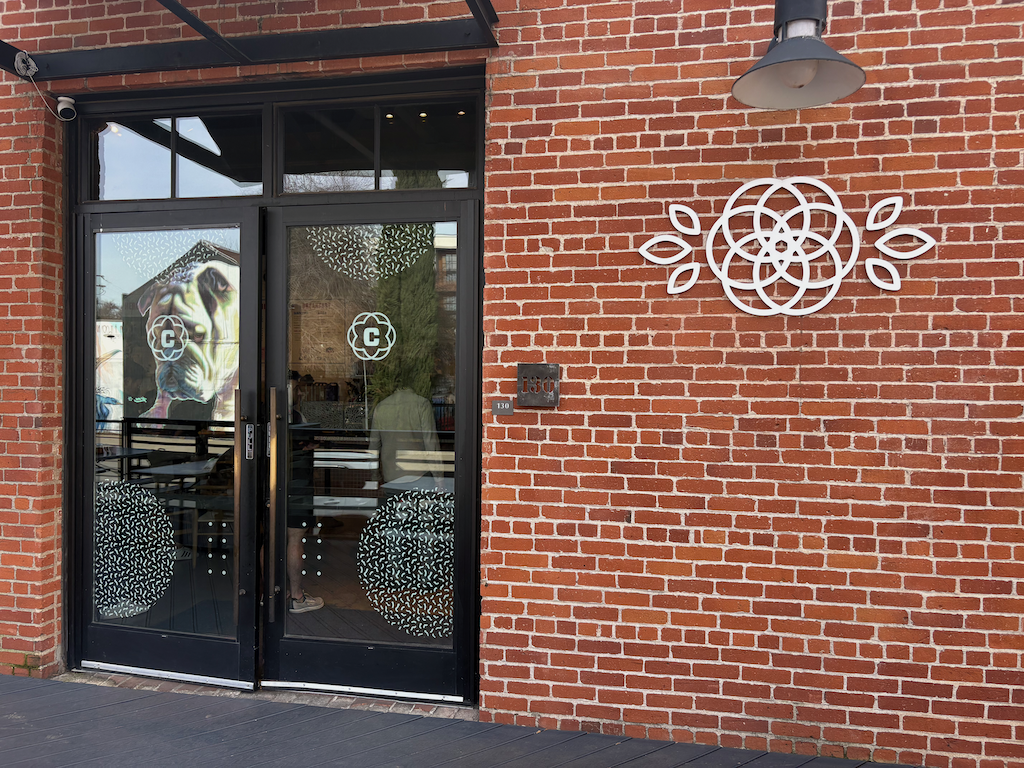
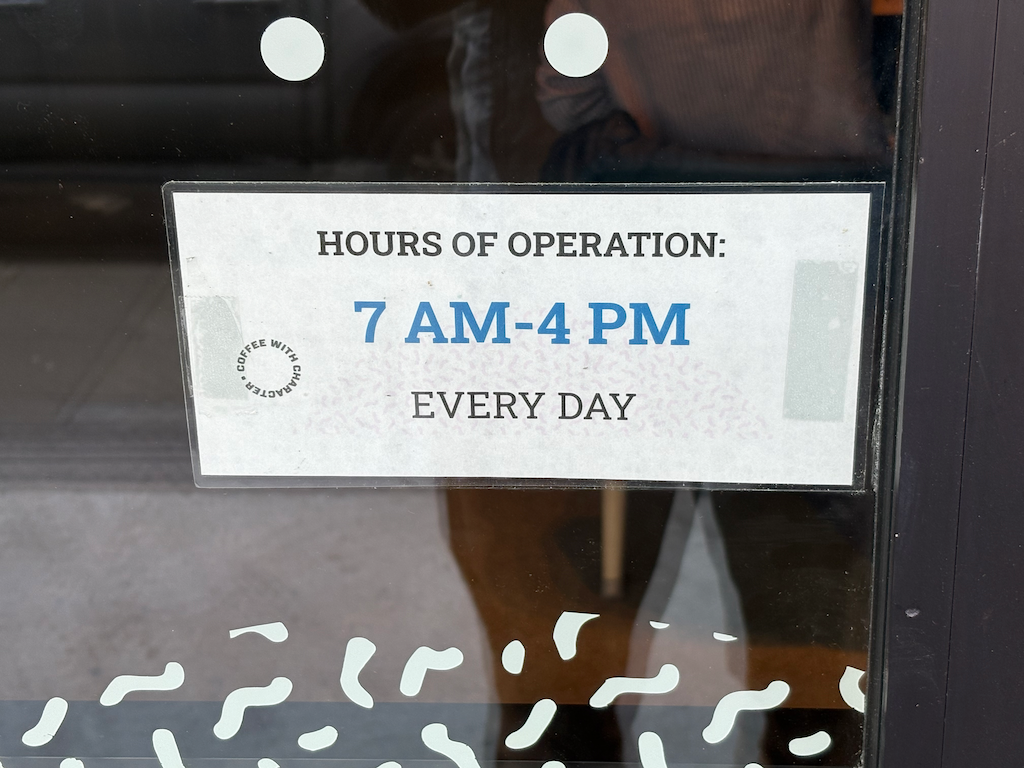
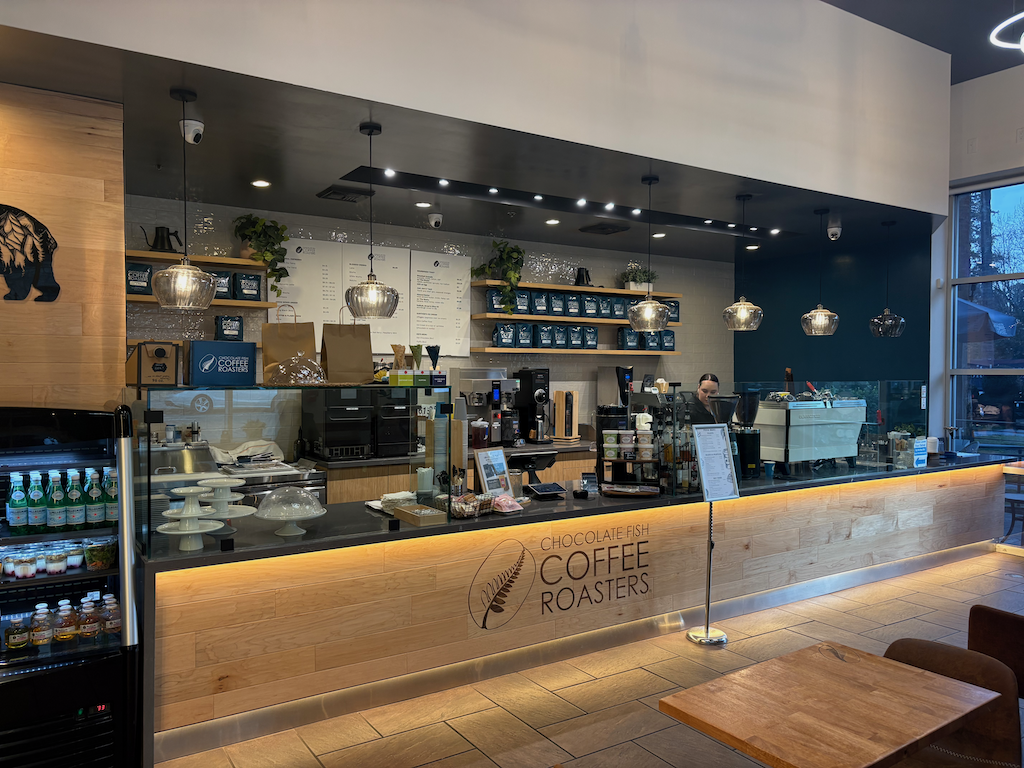
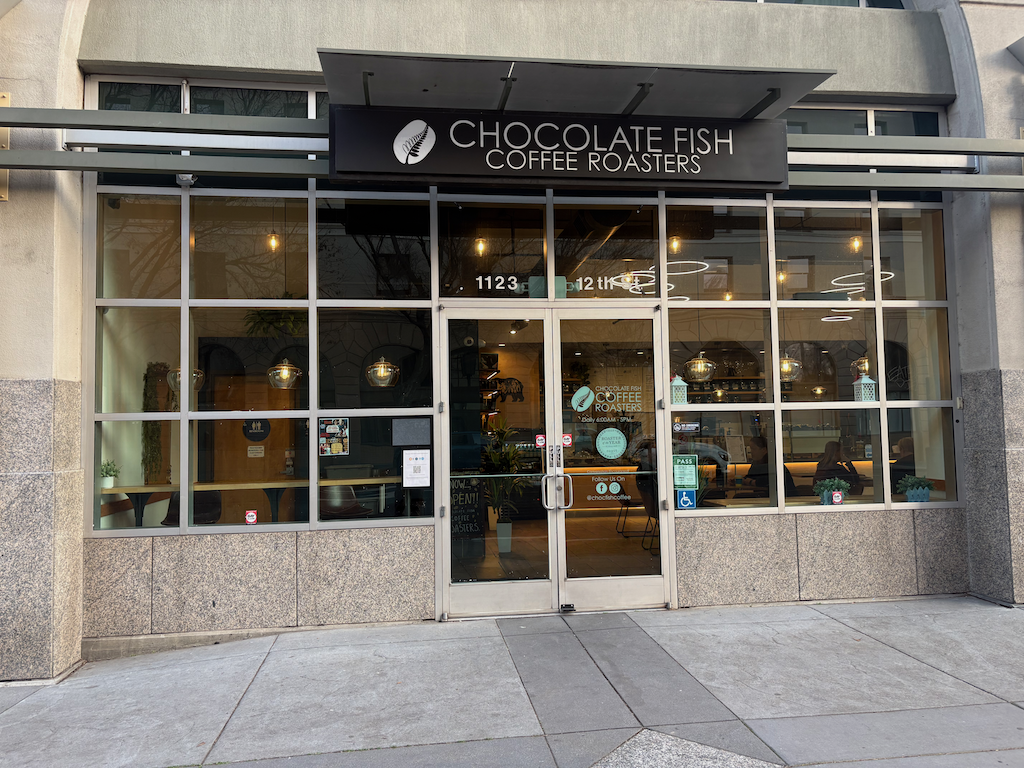
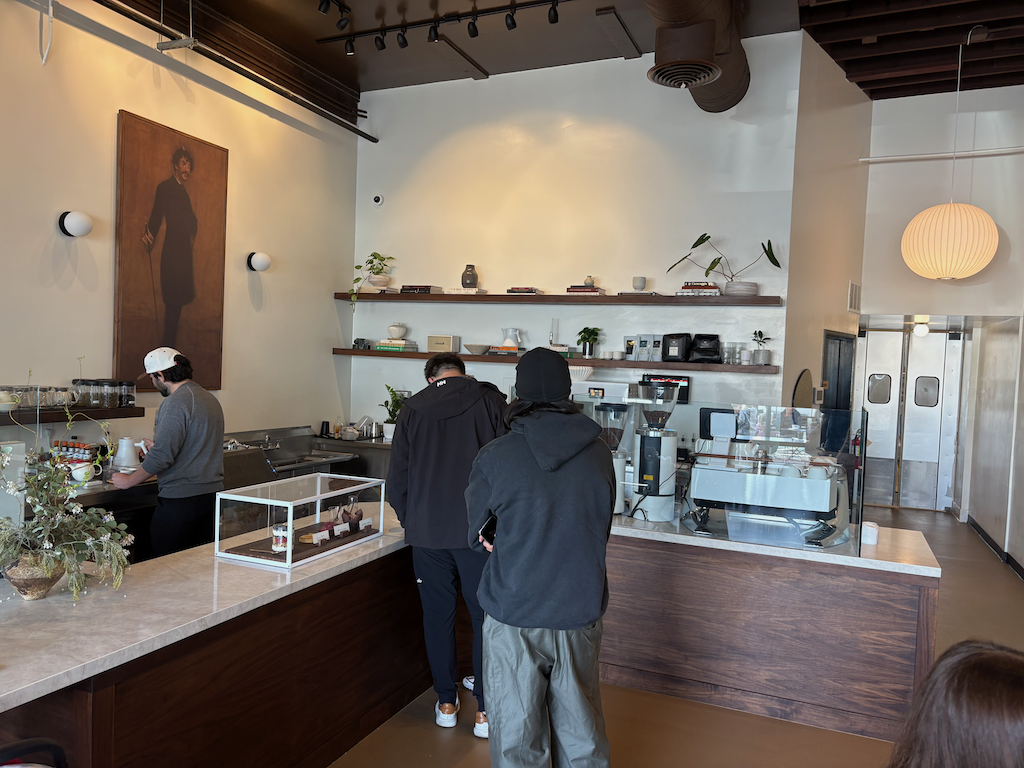
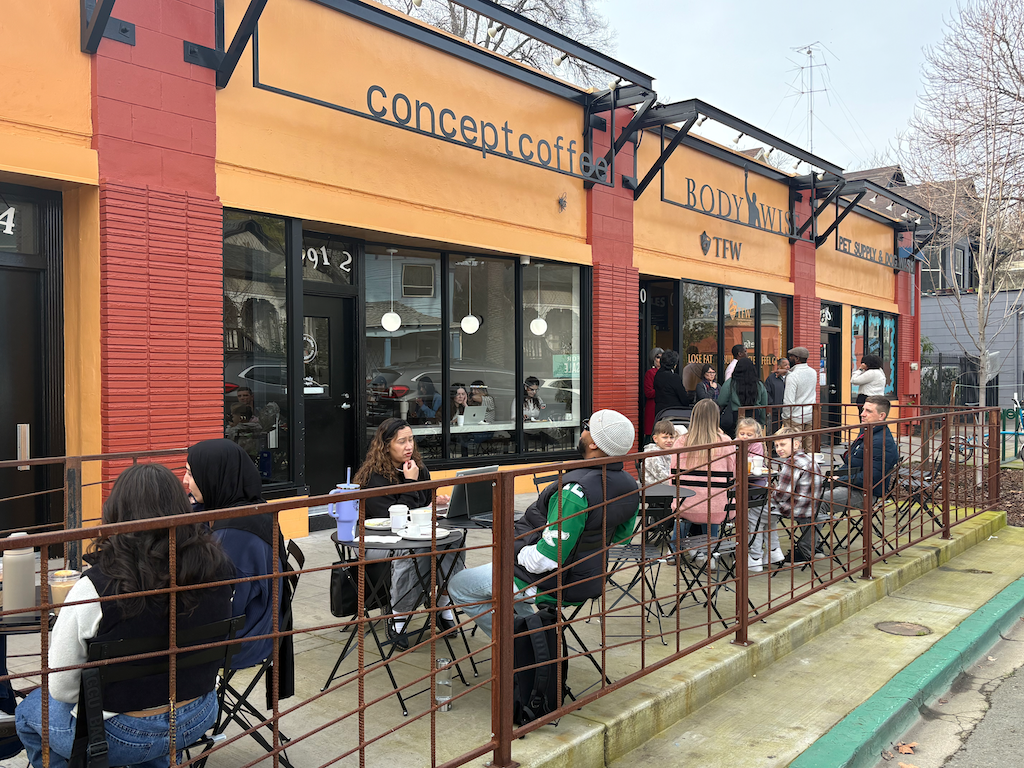
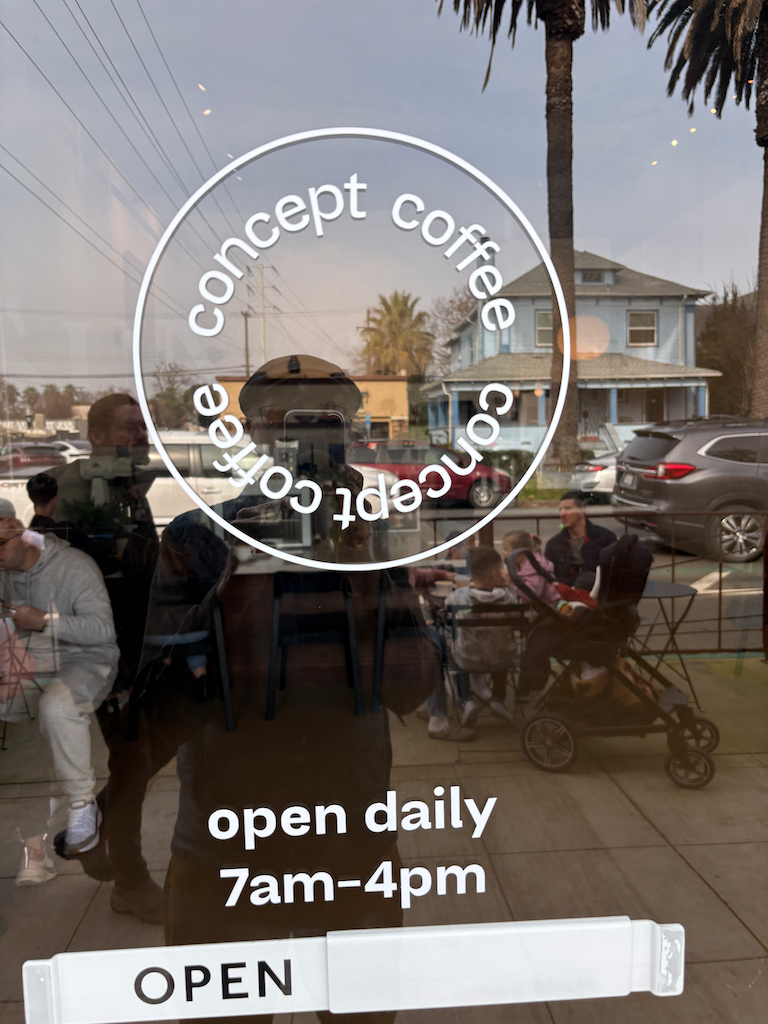
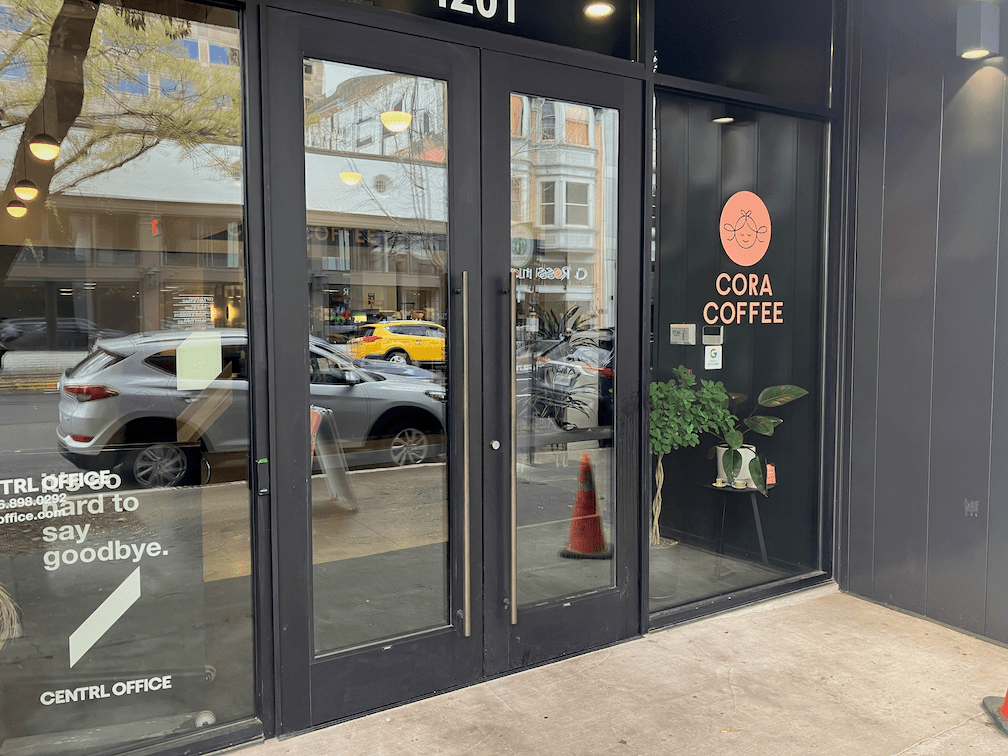
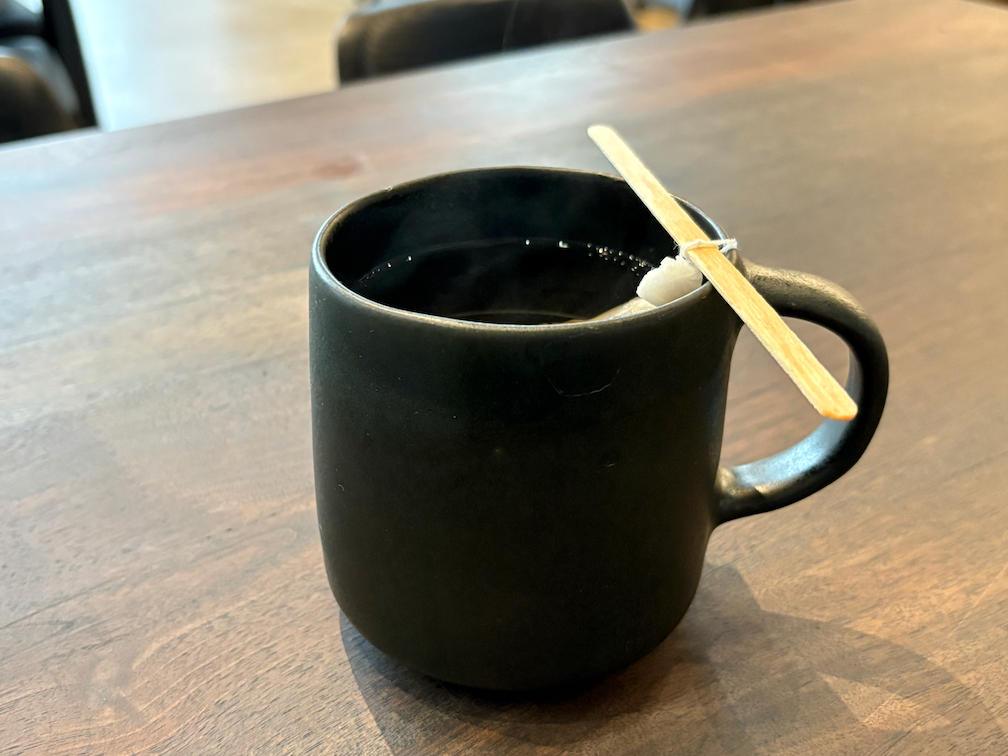
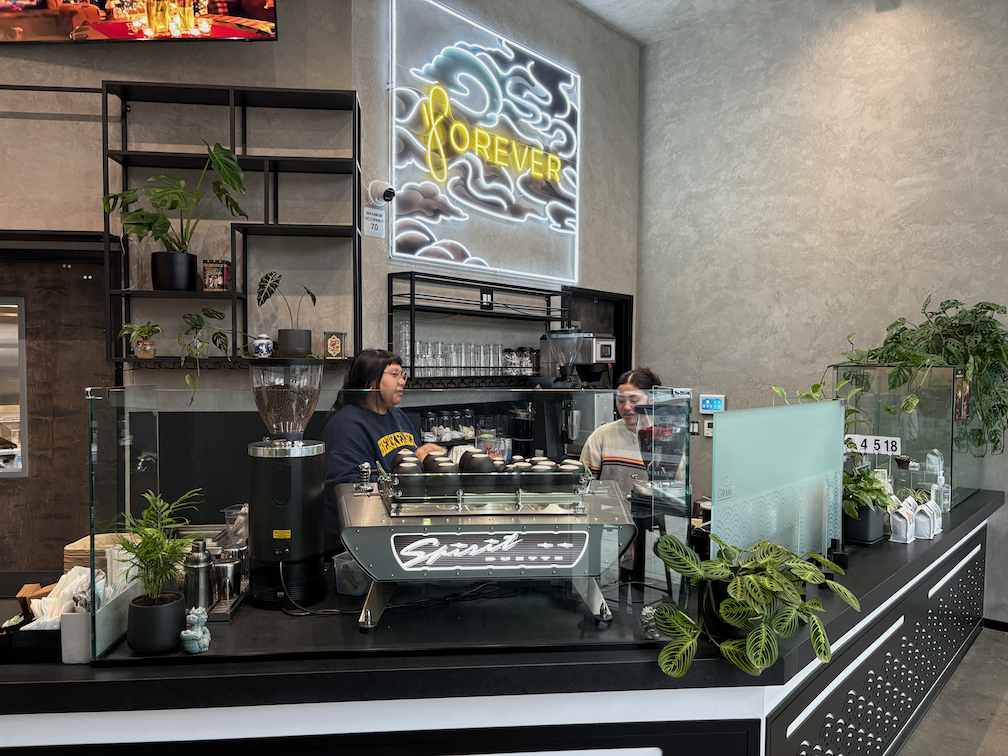
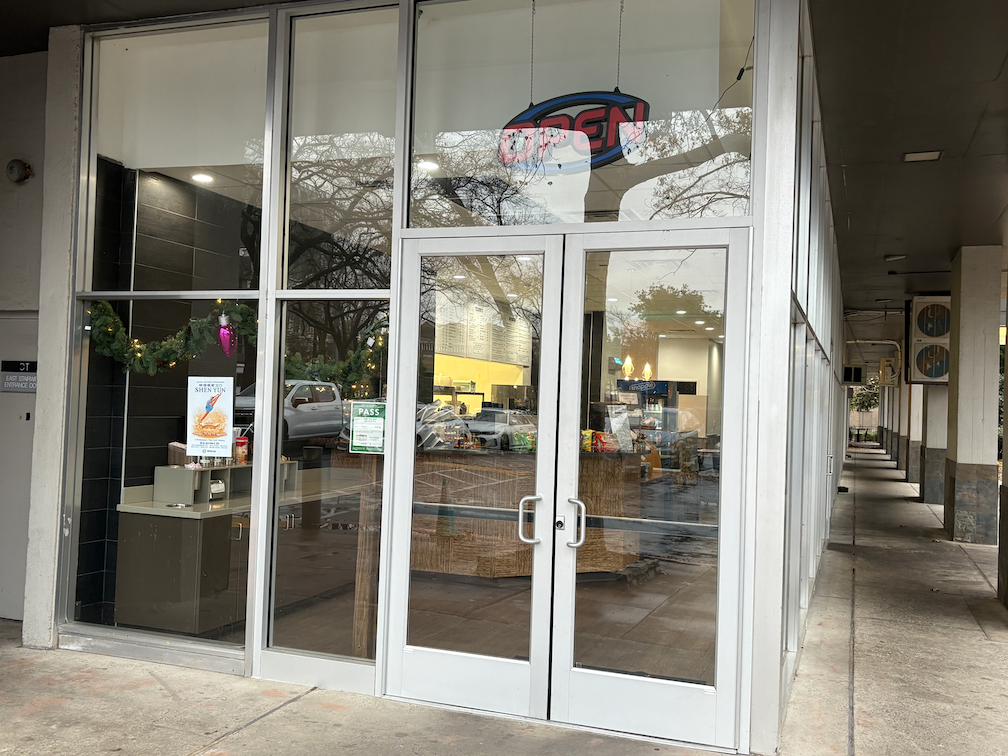
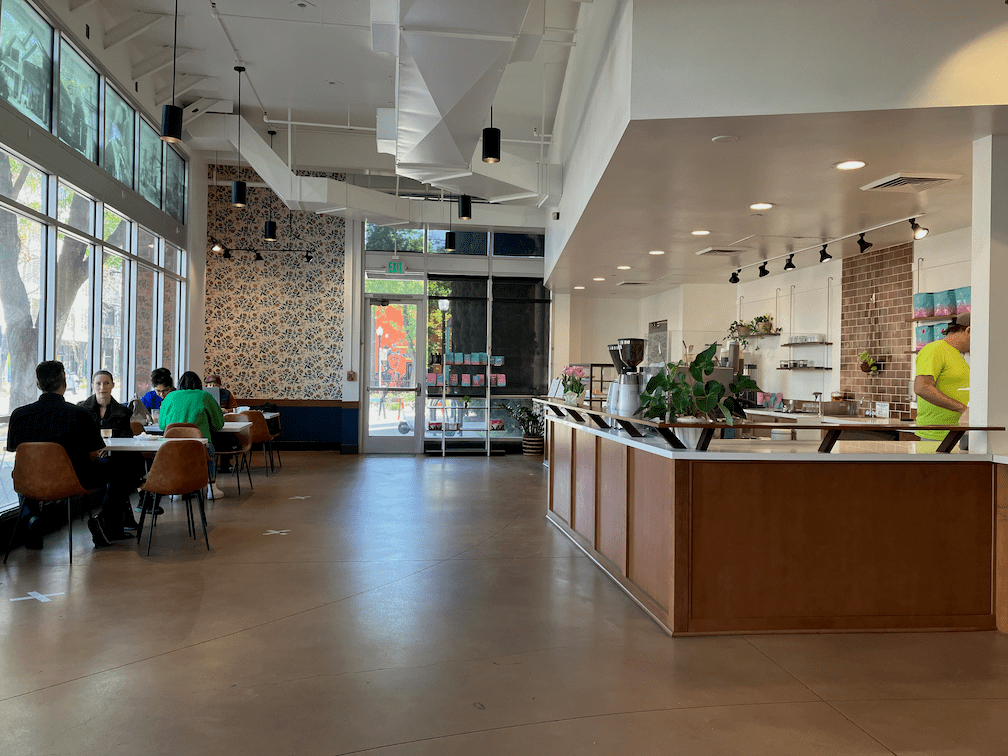
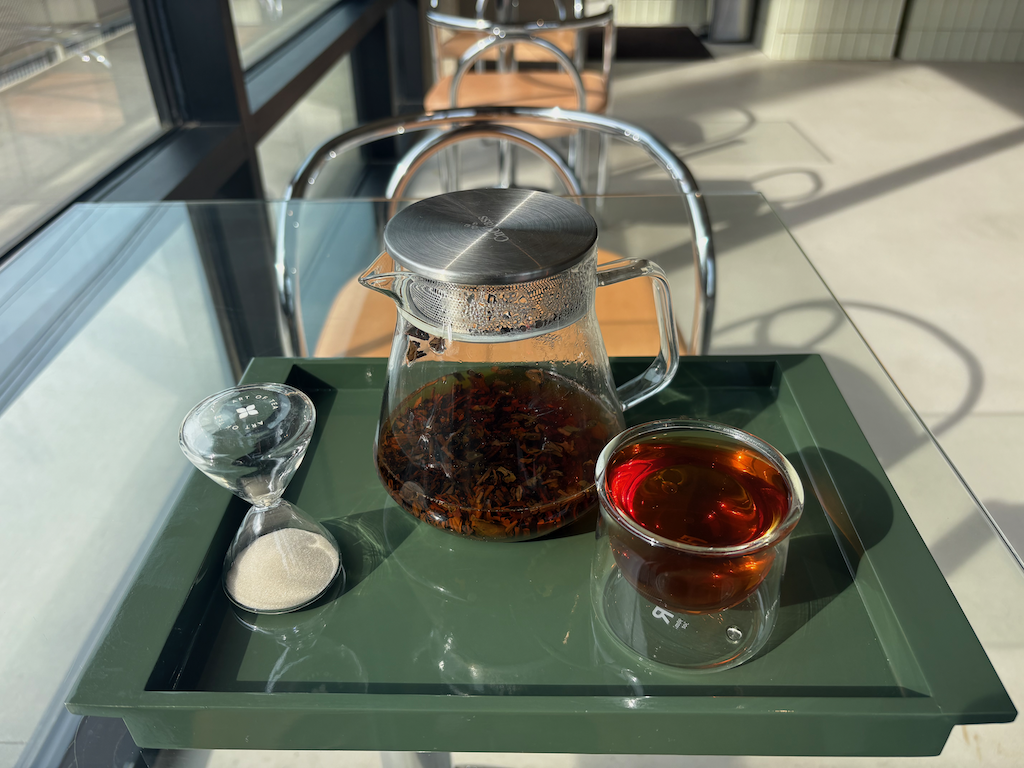
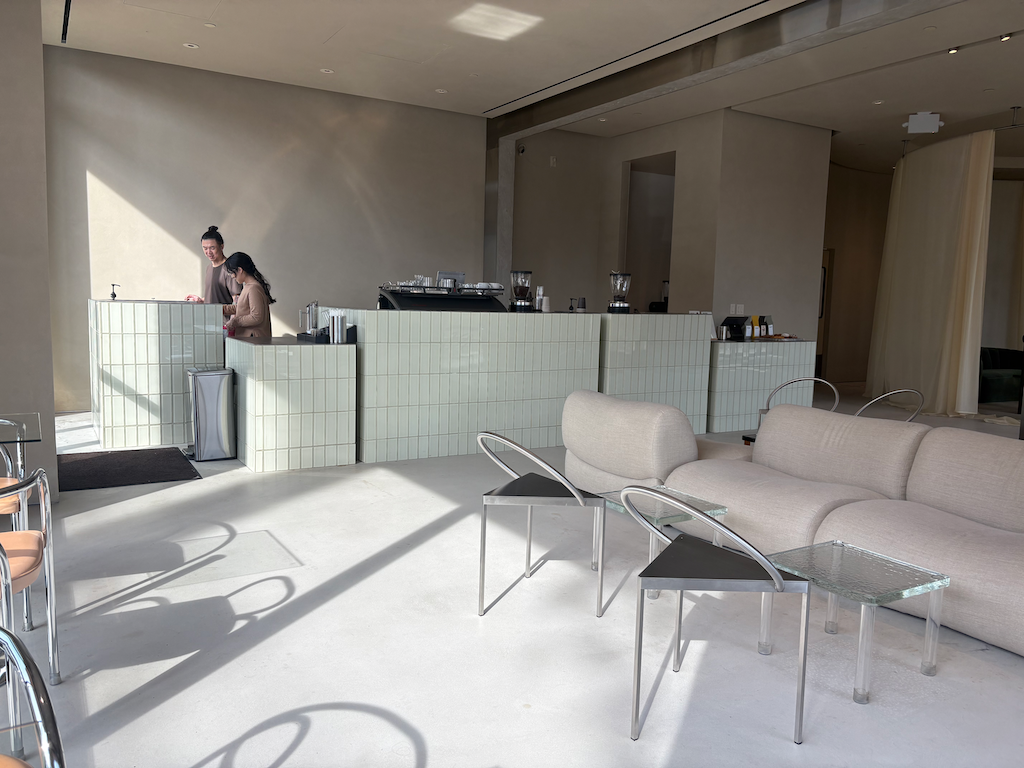
I changed from a slide show to a gallery for coffee shop photos, so that they could be captioned. Captioning is partially complete, and there will be additional photos to come, so check back. The photos are alphabetical by business name, more of less. For photos of business hours, take these with a grain of salt. They were accurate at the time of the photo, but may not be currently.


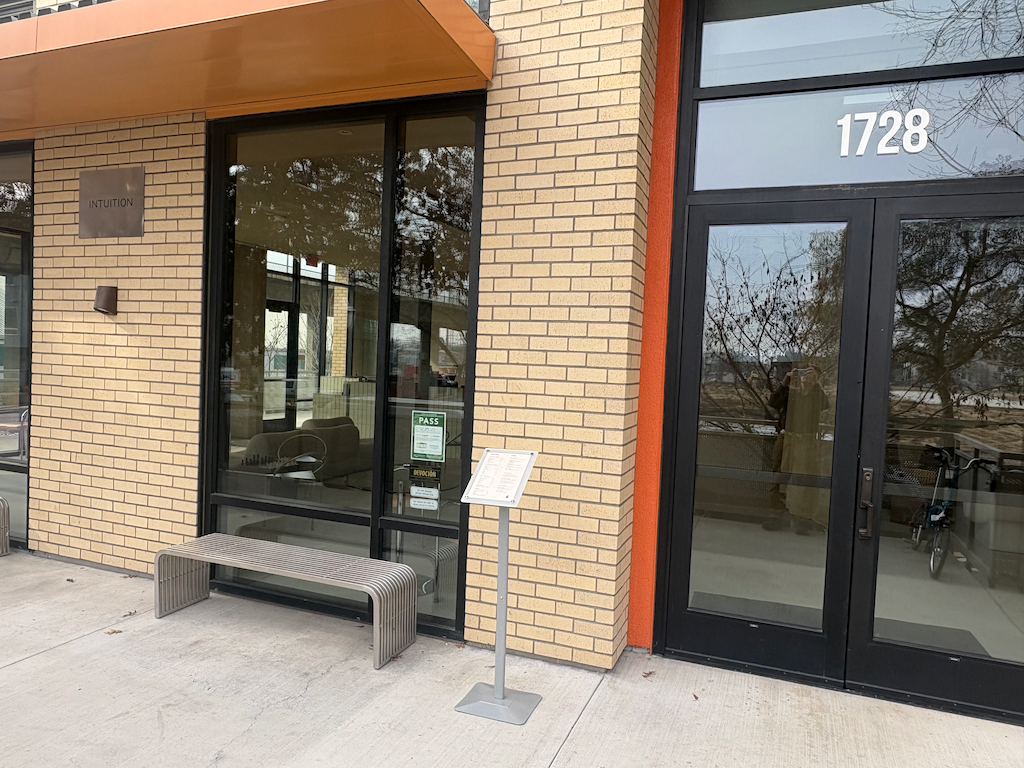
Intuition Coffee outside