The war of aggression started by The Felon Trump (grifter in chief) has sent gas prices soaring. Though the administration said this war was about nuclear weapons, I suspected from the beginning that is was not just about that. Whatever it was, the actions of Iraq and Israel and the US have now made it about oil.
This has had an impact on those who drive, and will eventually have an impact on those who fly and and even those who take the train, though long term contracts will stretch that increase out over time. For those who drive, this is a big issue. The cost of nearly everything has gone up, in part but not only due to Trump’s tariffs, and now this further increase on top of that. The cost of living is up, up, up. I have noticed myself that there are fewer cars on the street in Sacramento except during commute hours, when there are just as many as ever.
I have also noticed a remarkable lack of thoughtfulness on the part of people about what this means, and how to respond. In California, and elsewhere, politicians who were thought to be progressive are now touting the Republican talking points of reducing gas prices by suspending gas taxes, undoing climate change actions, and using oil reserves.
Several national media articles have summarized what drivers are thinking and how they are responding, with a few below, and thousands more in search (note: There were similar but more apropos articles, but I could not track back to them. Please comment if you have better links):
- ‘It’s Just Crazy’: High Car Payments Make Ownership Feel Impossible. NY Times, March 16
- The War in Iran Is Driving Costs Up. Here Are Some Ways to Save. NY Times, March 13
- Divided on so many things, Americans find unity in frustration at higher gas prices PBS News, March 10
What nearly every article seems to miss is that dependence on gas prices is the result of decisions made, individually and by government.
Has anyone said “I’m going to get to work on transit.”? Has anyone said “I’m not going to drive to get coffee.”? Has anyone said “I’m considering a different place to work, or a different place to live, so I don’t have to drive to work.”? Has anyone said “I’m going to contact my representative to insist that transportation funds be spent on transit, walking, and bicycling instead of increasing highway capacity.”? Well, actually, yes, to this one, that is the message of transportation advocates every day.
The appropriate response to a crisis, and yes, this is a crisis for low income people, should be to step back and think about what is not working, and how to not get caught by the same crisis next time. The appropriate response is NOT to say “I want gas prices lower so that I can keep on doing what I’ve always been doing.”
An recent article on Streetsblog USA (2026-03-16), What If The Rising Costs of Car Dependency Were As Visible As Gas Prices?, addresses not just the higher prices for gas, but the overall higher prices for everything related to driving. And those higher prices don’t even come close to accounting for the external costs of driving to health, environment, and livability. The degree of car dependency in the US is not some natural effect that somehow just happened. It is the result of the automative industry (“…what was good for our country was good for General Motors, and vice versa.” – Charles Erwin Wilson, Wikiquote) and fossil fuel industries convincing Americans that driving a personal vehicle was the only way to live the good life, and that other ways of getting around were un-American. Of course the government went whole-hog on this, investing trillions of dollars on making it easier to drive (and harder to live). The automotive industry and the fossil fuel industry were wildly successful. Few Americans, and even fewer politicians, believe that any other life is possible. And so long as the government, at all levels, continues to expand highways and invest most of our transportation funds in cars, this will not change.
So, what to do against this backdrop of car dominance and forced car dependency? Resist! Protest! Change!
Most of the foreign actions of our government, under primarily Republican policy, but Democratic as well, have been about oil. We invaded Iraq and overthrew their government because their president had the temerity to think that their oil belonged to the people of Iraq (and himself, or course). We deposed the leader of Venezuela because he could not produce enough oil at low prices for the US desires. The list goes on and on. Though someday our wars may be about water, for now they are about oil.
What can you do? Stop driving for choice trips. Yes, it is convenient, and yes, it harms us all. Start making a long range plan to free yourself of car dependency. It might be quick, it might be slow, but please move in that direction. Speak up to your representatives, and attend meetings, asking that we stop funding highways and cars, are start funding transit, walking and bicycling.
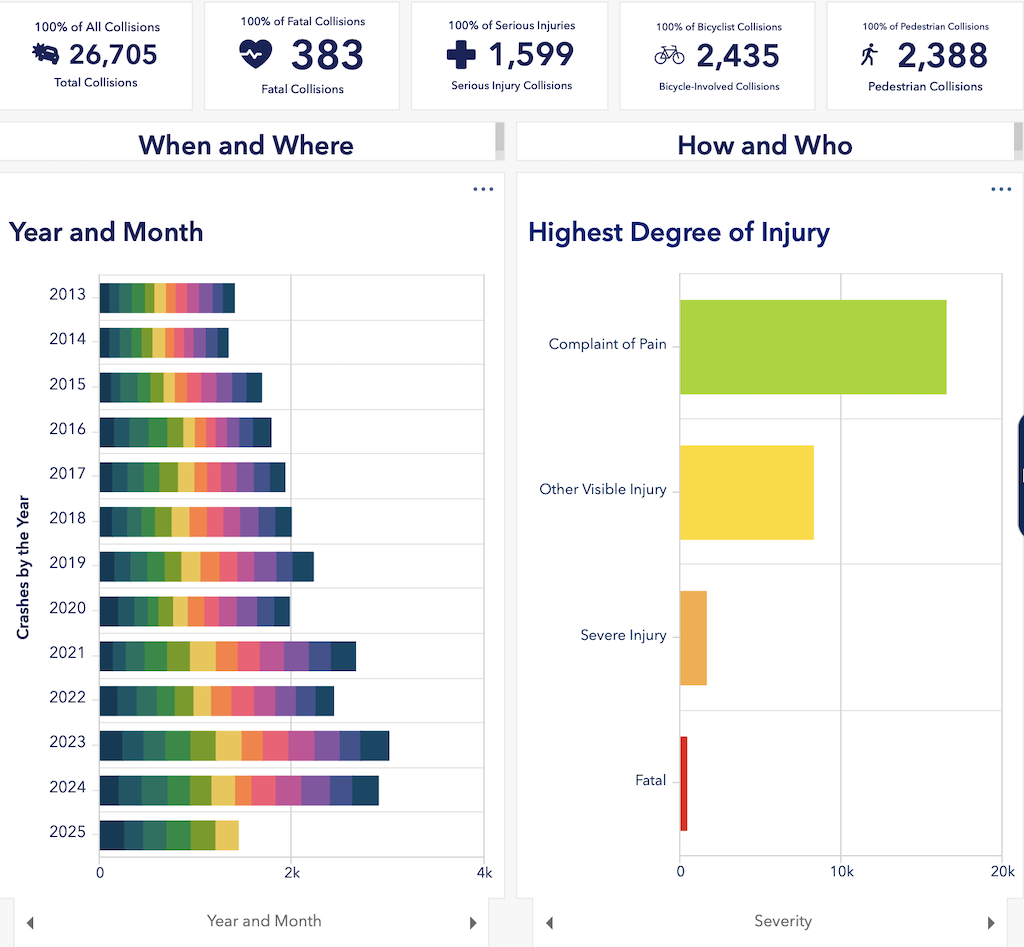
The first image below is from the Streetsblog article. But the City of Sacramento Vision Zero program does, to its credit, have a Crash Dashboard, graphic following.