Parks in the central city

Winn Park

Winn Park, a block-square park between P & Q, and 27th & 28th, seems dead to me. It doesn’t matter what time of day I see the park, it is almost always empty, sometimes with some homeless folks hanging out, and more rarely, a family with kids on the playground equipment. Other parks seem lively much of the day. Why are the parks so different? I have been visiting all the parks in Sacramento central city to take photos and see if I can make sense of their characteristics.

Read More »

parks and green space

Strong Towns had a post yesterday “Why greenspace is different from a park” that got me thinking about parks and green spaces in Sacramento. As a commenter said, it is the quality and use of the land, and the relationship to space around it, that is most important, not the park or greenspace binary. 

Two dead parks come immediately to mind, Winn Park in midtown (P & Q, 27th & 28th), and Crocker Park (N & O, 2nd & 3rd). How are they dead? Very few people ever use them, certainly not enough to make the space feel used and safe, as the blog post points out is so important. In Winn, there is finally a small playground, but overall it does not make the park feel any less abandoned. Crocker Park as nothing to do. Yes, both places have trees and grass, but those thing are not in short supply in Sacramento. Several other square block parks feel alive.

Roosevelt Park (P & Q, 9th & 10th) has sports and a nearly continuous pick-up basketball game going on. Fremont Park has a larger playground, a fountain in the summer, benches, and events such as Chalk It Up. Probably most importantly, it has both residences and business on adjacent streets. The park is not the only reason to go there. Cesar Chavez Park (I & J, 9th & 10th) is probably the busiest small park in the region. It is a homeless daytime retreat, has a lot of events, now has a cafe again, and is surrounded by business and government, particularly the library. Many reasons to go there. There are several other one-block parks in downtown and midtown that I’m less familiar with. 

Crocker Art Museum is working up plans to activate Crocker Park by integrating it better with the museum. I think they’ll do a good job, though funding may slow the solutions. The city is finally talking about activating Winn Park, but I don’t think there is a plan yet. I’m sure some people in the neighborhood would be horrified, but what Winn needs is not just a park with more things to do, but more facing retail business and higher density housing. There is a bit, such as Lou’s Sushi, but it needs more. More things to do not just in the park, but around the park. 

The Strong Towns post also talks about green spaces, those areas left to grass or sometimes more interesting vegetation, but not really serving any purpose. In Sacramento, there are green spaces along some of the freeways. This is dead land, and few people want to even be there, but as the commenter points out, it can be used to handle stormwater and to filter air pollution, if designed properly. In newer subdivisions, there is often green space along the main roads. How this is of benefit escapes me. Those people whose back fences face a busy street have and will alway have lower property values, and no amount of non-native plants is going to change that. Front yard greenspaces are a horror in the suburbs, perhaps the thing most responsible for making suburbs the low value communities they are. People retreating into a set back house with a moat of grass is the problem, not the solution, to livable and responsible communities. The inner ring, older suburbs have this issue to some degree, but the setbacks are much less, and the lack of snout houses (those showing their very best two, three, four cars garages to the street) makes it acceptable. Sacramento downtown and midtown of course have a lot of temporary green space, places where housing was torn down (some which could have been repurposed or rehabilitated, and some not) and the planned replacement never built. I suppose it is good to have some land “banked” in this way, but we have far too much. 

And then there is Capitol Mall. Vast grass in between tall buildings, and never used by anyone except for a few major events each year. I suppose that someone thought a grand entrance to Sacramento was needed, along the lines of a city of skyscrapers and parks envisioned by Le Curbusier. But it is pretty much useless. It is not a park in any sense of the word. There have been suggestions over the years of how to fix this, including Rob Turner in Sactown Magazine: Boulevard of Broken Dreams. But solutions will be expensive and contentious. 

Rain swales are another type of greenspace which I have apparently not written about, but will. There ar several close to where I live. 

Walk Score update 2016-12

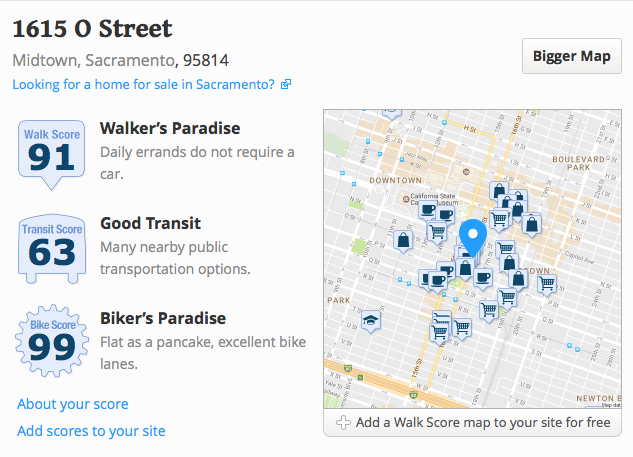
Walk Score offers an assessment of the walkability of any location. It is available in any browser at https://www.redfin.com/how-walk-score-works. The Redfin app shows walk score, bike score and transit score for each listing (scroll way down). Walk Score is based on the distance to the places people want to go, such as grocery stores, restaurants, coffee shops, bars, movie theaters, schools, parks, libraries, bookstores, fitness locations, drug stores, hardware stores, and clothing & music.

I’ve been curious about whether my Walk Score has changed with all the recent development in the area, since my earlier posts Walk Score (2012-03), Transit Score (2012-04), Bike Score (2012-05), and WalkScore update (2014-01). It has!

In March 2012, my Walk Score was 85: Very Walkable. In January 2014, my Walk Score was 82, Transit Score 62, and Bike Score 99. And today, my Walk Score is 91: Walker’s Paradise, Transit Score 63: Good Transit, and Bike Score 99: Biker’s Paradise. No big change in transit or bike, but a climb in walk score. And I am still tickled pink to be living where I do, in midtown Sacramento.

Quite a bit has changed on the Walk Score website over the years, and it is now much more focused on real estate. It has more in-depth information, but the algorithm is still proprietary. One of the beta features is a crime score, and my neighborhood ranks as a B.

walkscore_2016-12

Slow Transportation (part 3)

3. What Slow Transportation Isn’t

It isn’t flying in airplanes.

It isn’t driving over 25 mph except on roadways designed for higher speeds that connect places rather than go through places. For example, the highway to the mountains. But not the stroad arterial in your neighborhood, and never a residential street. In fact, 20 mph is a better number (see Twenty is Plenty).

It isn’t driving your kids to school.

When I ask people why they have a car, they most often answer one or more of three things:

  • to get to work
  • to buy groceries
  • to get to the mountains or the beach

There are solutions for each of these. If one choses to live far from work, or work far from home, driving is almost inevitable. But people do change jobs and housing, much more often than they admit, and could make the choice to be closer. Work and car are a classic Catch 22: I work to pay for my car, I have a car to get to work. It need not be this way. One can choose a job/housing situation allows walking, bicycling, or transit.

People’s grocery shopping patterns lean towards two extremes: 1) driving a mile to pick up a quart of milk; or 2) buying so many groceries at a time that they could not possible be carried by walking, bicycling or transit. But there is a middle ground, making more trips to the store and buying quantities that are walkable, bikeable, transit-able. That is what most of the people in the world do, and it is what we can do. Sure, maybe you do need a car every once in a while for a particular item, but most of the time, no. No. No.

I understand getting to the mountains and beach. I travel to the mountains a number of times during the summer for backpacking. I travel to the bay area about once a month for the ocean and the culture. But for neither trip do I use a car (I don’t have one, don’t want one). I use public transportation, and some bicycling, and some walking. If you are going camping, perhaps you do need a vehicle. Rent one, or find a friend with one! You don’t need that large vehicle sitting in your driveway, or driving around town. And, to be honest, you don’t need to be running to the mountains every weekend during ski season or summer, or the beach every weekend during the summer. Slow down, enjoy the place you live a little more. Yes, Sacramento during the summer can be a little hard to take, but the river is close by, or a cool bar with cold beer.

“You can have a city that is friendly to cars, or friendly to people, but you cannot have both.” —Enrique Penalosa

part 1 | part 2

Slow Transportation (part 1)

Recently I was emailing a friend about a Slow Food gathering, and facetiously used the term “slow transportation” for getting there by train rather than flying. But the more I thought about it, the more the term resonated with what I believe in and what I work on. I have not heard, so far as I’m aware, the term used anywhere else, but I think readers of this blog will immediately resonate with it as well. What follows is a first attempt to pin down a working definition of Slow Transportation.

I am going to break this topic up into several posts, but at the end I’ll make it available as a single document in case that is of use to you.

1. What is wrong with our present transportation system?

I am going to keep the list short and succinct because I think most readers of this blog will either already be aware of the issues, and/or will agree that these are the problems. Entire books have been written about each of these issues!

Note: Don’t be depressed by the list of problems below. I promise I won’t leave you there for long.

  • transportation accounts for a significant part of greenhouse gas emissions (37% in california, 26% in the US, and 14% worldwide) as is therefore a major driver of climate change
  • we have emphasized mobility over access, the ability to get somewhere – anywhere, rather than the ability to get to places we want to go; there is an incredible amount of aimless driving, just for something to do, running a small errand to take up time and fill an empty life; only about 15% of car trips these day have anything to do with commuting to work
  • the convenience and low cost of driving has encouraged the separation of functions, where we live, work, recreate and socialize, diminishing the value of each place; though this has started to reverse, we are so far down this road (literally) that it will be hard to bring these back together
  • privately owned motor vehicles isolate people rather than bring them together
  • traffic violence is inherent in a system based on private motor vehicles; even when people are not killed and injured by the drivers of motor vehicles, they are still intimidated out of the public space, knowing they are at risk there and are being actively discriminated against
  • our cities, counties and states are either already insolvent or on their way to insolvency, in part due to the fact that we do not have and cannot ever have enough money to maintain the transportation infrastructure we have already built; though roadways are the worst of this, it is also true to some degree of transit systems, and most certainly our air transport system
  • our current wars are in significant part about oil, oil wars; if you don’t think this is so, ponder the fact that the former head of Halliburton, an oil exploration and facilities company, got us into the Iraq war and Halliburton was the prime contractor for that war; it is not just the US with guilt and blood, most of the wars today are at least in part about oil
  • we transport our food long distances, disconnecting us from the source, the soil, and the people who grow it; industrial agriculture is both dependent on and a driver (literally) of our unsustainable transportation system; again, this is starting to reverse, but we have lost much of the smaller farmer and small processor capacity of our country, and it will take time to rebuild
  • the housing affordability crisis is in part due to a focus on housing costs without considering the transportation costs; the Center for Neighborhood Technology’s H+T calculations indicates that much of the current housing stock is unaffordable because it is located so far from jobs and amenities; it is not really the urban areas (so much in the news) where housing is unaffordable, since transportation costs there are so much lower, but the suburbs and exurbs
  • our transportation system takes up too much of our wealth, particularly in the preference for mega-projects like new bridges and freeways, and inattention to small projects that would have greater benefits; there are plenty of things we could be spending transportation money on instead; I dont’ want to minimize the value of transportation investments, but to ask that they have the a similar social return to other things we could spend on
  • our transportation system takes up too much of our space, not just with roadways and interchanges, but with parking garages and parking lots and on-street parking; as a result of all this space devoted to one mode of travel, the private vehicle, everything must be further apart, thereby requiring even more driving, in an ever-downward spiral
  • our transportation system both encourages and depends upon greenfield development, which leads directly to loss of wildlife habitat and agricultural lands; we already have enough housing stock, but a preference for heavily subsidized greenfield development leads to abandonment and neglect of the sufficient housing stock we already have; greenfield development must stop, now and forever
  • there are so many externalities to private car use, costs that are borne by other individuals and society as a whole, that it really amazes me that we even allow private car use
  • we have reached peak car; peak does not necessarily mean the greatest number of cars or the greatest vehicle miles traveled, but it means the point of diminishing returns; the costs are now overwhelming the benefits and nothing we do can change that, except to walk away (literally) from dependence on motor vehicles

“The automobile has not merely taken over the street, it has dissolved the living tissue of the city. Its appetite for space is absolutely insatiable; moving and parked, it devours urban land, leaving the buildings as mere islands of habitable space in a sea of dangerous and ugly traffic.” —James Marston Fitch, New York Times, 1 May 1960

Park(ing) Day September 16

Park(ing) Day is this Friday, September 16. Though there do not seem to be any formal events or locations this year in the Sacramento region, I would imagine some will pop up (Park(ing) parks are pop-up parks). So keep your eyes open, and if you come across one, please post a photo with location to your favorite social media. For more information about the worldwide event, check http://parkingday.org.

Myth: housing more expensive in dense areas

Todd Litman recently gave a talk at Transit 101 presentation hosted by 350Sacramento and others. There were some comments afterwards questioning some of what he had to say and his premises.

One of these was “He also ignores that the type of concentration he is advocating significantly increases the cost of housing.” Litman did present densification as one of the solutions to transit systems that are too spread out to function effectively, which is certainly one of the issues for SacRT.

If one looks only at the price of housing, the cost does usually increase as one moves from the suburbs towards the urban core. Though the pattern is actually much more complicated than that, with some inner-ring suburbs doing quite well while others are in steep decline. But the price of housing is only one aspect of living costs. The big, and often forgotten or dismissed, cost is transportation.

The key resource for exploring the tranportation aspects of housing affordability is the H+T Index (housing plus transportation) of the Center for Neighborhood Technology. To quote:

By taking into account the cost of housing as well as the cost of transportation, H+T provides a more comprehensive understanding of the affordability of place. Dividing these costs by the representative income illustrates the cost burden of housing and transportation expenses placed on a typical household. While housing alone is traditionally deemed affordable when consuming no more than 30% of income, the H+T Index incorporates transportation costs—usually a household’s second-largest expense—to show that location-efficient places can be more livable and affordable.”

The map below shows the H+T index for a part of the Sacramento area. Light colors are affordable, dark colors are not. The general pattern is that housing becomes less affordable the further one goes from the urban core, though the pattern is of course complex. Part of Arden-Arcade is unaffordable both because housing is very expensive and it is a transit desert, while other parts are more affordable because housing is less expensive and it is not quite as much of a transit desert.

CNT_sac-HT

The devil is in the details, so I’d encourage you to explore the maps at CNT in more detail to see how this calulation works for specific areas, and how the H only (housing only) map compares to the H+T (housing plus transportation) map. I’ve written a bit about H+T before (Abogo), but it is always worth coming back to these very important concepts.

A lot of what people think about when they think about high costs in dense places are the really dense places, New York, Paris, San Francisco. However, the high costs of those places has as much to do with demand as with density. These places are expensive because so many people want to live there, and with limited housing options, competition drives prices up. In fact, the lower costs of suburban housing can be explained in large part by the far lower demand for such places. Not many people want the suburbs, so there is little competition for housing there, and prices stay lower. This is an oversimplification, but nevertheless true, and one of the perspectives that needs to be considered when looking at housing prices.

Another aspect of this misunderstanding is that many people envision densification as leading inevitably to very dense urban areas, which they associate with poor livability (though others seek out these dense areas), what are sometimes called inner cities, skyscrapers and tenements. Densification can mean intermediate densities, such as houses on smaller lots, multi-family housing, and buildings of moderate height up to five stories. Of course some people don’t like that either, but this is the minimum necessary for a functional transit system. The “new-traditional” format of houses on large suburban lots, or even worse, very large houses on very large exurban lots, cannot support a transit system. In the Sacramento area, midtown is an example of a moderate density place. It has single family homes, but also multi-family houses, apartment complexes, low-rise residential buildings, a good mix of housing types. And it is hardly dense at all, at least in my view.

Beyond the direct costs to the invidual homeowner/renter, however, are the costs we pay in sales tax and property tax, as well as fees, to build and maintain infrastructure. Infrastructure in less dense areas costs much more per household, or per square foot of floor space. Everything is longer in the suburbs: power lines, water lines, sewer lines, telephone/cable TV lines, roads, freeways, and most specifically distance to amenities. Everything. So far we have hidden that cost by having everyone pay equally for infrastructure, but if people were charged both for initial construction and maintenance by the amount of infrastructure per household or square foot, people who live in the suburbs would be paying much more for their services. As it should be. In fact, most of the suburbs are financially unsustainable since they can never generate enough sales tax, property tax, or fees to pay for what it really costs. That is in part why the suburbs are falling apart – there simply isn’t enough money to keep them going.

The cost of living in denser areas is less, the cost of living in less dense areas is more.

No more urbs in the county?

In Sacramento County, there are suburban areas in both the county and in the various cities. Northern Sacramento (the area north of the American River) is largely city. Eastern Sacramento is largely county, with the exception of Citrus Heights, Folsom, and Rancho Cordova. Southern Sacramento is largely Sacramento City, except for a finger of county suburbs that intrudes into the city, and of course Elk Grove. I suspect most people who don’t own property even know whether they live in county or city because the development pattern is very similar, and the deterioration of infrastructure in the county is only slightly ahead of the cities.

Sacramento County is not able to keep up with what it already has. Potholes are everywhere. Neighborhoods are deteriorating, businesses are boarded up, or are replaced with low-quality businesses such as tattoo parlors and liquor stores. Sacramento County wants to be a place with low taxes, but low taxes equal deterioration. So what the county does to try to make up for a lack of sufficient tax income is to push greenfield developments that will bring in a shot of property tax, and perhaps sales tax, but in the long run will just be more of the same, a drain on the government and economy. Greenfield development never pays for itself in the long run, it is just a transfer of wealth from the future (future taxpayers) to the present (mostly developers, but to some degree government and current taxpayers).

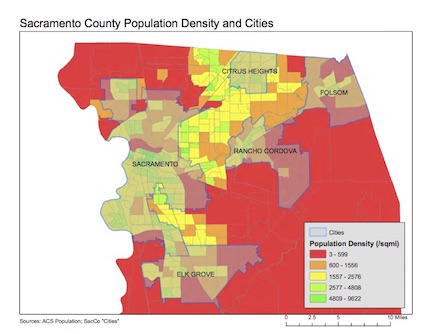
So, a modest proposal (modest in the Swiftian sense). All urban and suburban areas must be in a city. If a new greenfield development occurs, it must either be joined to an existing city, or become its own city (though I think we’ve seen the last of the mega-projects that would support a new city). All existing suburbs in the county will be moved into the nearest city, or form a new city. At the same time, all undeveloped or very sparsely populated areas should be moved outside the cities and back to the county. The map below (also pdf SacCo_pop-density-cities) shows population density with an overlay of the cities. Citrus Heights is the only city that does not contain any significant undeveloped land. Rancho Cordova, Folsom, Elk Grove and the City of Sacramento all contain undeveloped land which should revert to the county. The break points shown are not magical or legally defined. Clearly red (very low density) areas should not be in a city, but orange (low density) is not as clear. Yellow, light green, and dark green are clearly urban or suburban and belong in cities. (Apologies for leaving out Galt and Isleton, but they are not significant in this discussion.)

SacCo_pop-density-cities

It is likely to take some time to figure out boundaries, particularly since the Sacramento Local Agency Formation Commission (LAFCo) would have to negotiate boundaries and approve changes. I am not sure what to do with the exurbs, though in some ways it doesn’t matter since they will die out of their own accord.

Once the re-balancing happens, then it should become nearly impossible to move lands between the cities and counties. Greenfield development does not serve anyone except greenfield developers and politicians currently in office, and it impoverishes the future. We already have an overabundance of these types of sprawl subdivisions, enough probably to meet any possible demand and lasting for the foreseeable future. All development would shift to infill. The county would therefore be largely rural, and the county could focus on the far lower level of infrastructure needed to support rural uses. Taxes in the county would drop to a fraction of what they are currently, though of course taxes in the cities would probably increase to nearly counterbalance that reduction.

Some things would be better, some things remain the same. There would likely be less greenfield development, since the county is the largest driver of greenfield development. But there would still be some. North Natomas, south Rancho Cordova, and south Folsom are classic examples of greenfield development. Cities would, I believe, spend their money in a more efficient manner, and would not have to sacrifice tax money to the inefficient county government. By the way, no more deals where the county gets to keep property tax income without having to provide any services. Though it is admirable that the new cities, and their citizens, felt strongly enough about getting out from under the burden and mismanagement of the county that they were willing to give up property tax for a period of time, this should never be allowed again.

The big challenge for existing and new cities would of course be taking on these non-productive medium density areas. The cities will have nearly as hard a time funding infrastructure maintenance and repair as did the county, but at least they will be able to make decisions about where to invest in a more rational manner than the county.

Central city commute times

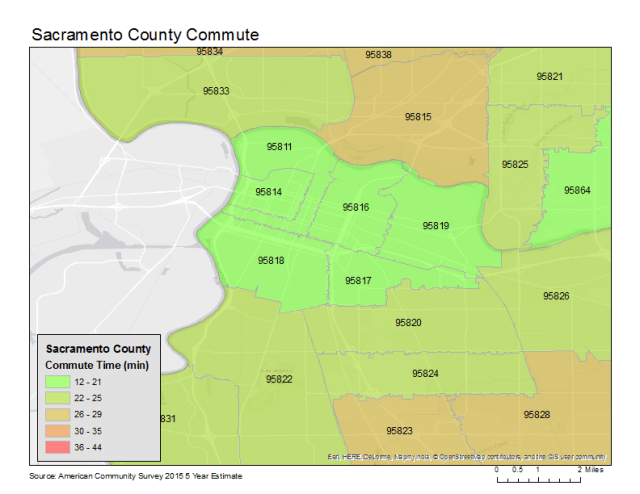
Here is the second map generated from American Community Survey data, this one showing average commute times by zip code. Nothing surprising here, the central city still compares well with other areas of the county, but there are some interesting patterns in the Sacramento County map (commute time), such as the northeast county in which I’m guessing people are commuting to Roseville rather than downtown, and therefore have reasonable commute times.

Sacramento-central-commute-time

If I were looking at commute times for surrounding counties, I suspect the average commute times would be significantly longer, since many people are commuting into employment centers such as downtown, Roseville, and Folsom. I have to admit that my own commute is long, 30 minutes to 90 minutes depending on where I’m working in the eastern suburbs. But I’d much rather be on a bike for 90 minutes than in a car for 20 minutes. I use transit at times, but for most trips it is either the same or longer to my work destination, so I use it mostly on horrible weather days and when I need to get work done on the way there or the way home.

Since this map doesn’t require much explanation, I’ll say more about census data. The American Community Survey has some very complex questions, such as whether you departed for work between 6:00AM and 6:30AM, but it can’t seem to find the bandwidth for some simple but very useful questions such as “Is your commute multi-modal? What percentage?” A person can only answer in one category: car/truck/van, bicycling, walking, transit, or other. If a trip is 51% transit and 49% bicycling, it shows up as an entirely transit trip. If a person drives 15 minutes to a parking garage and then walks 10 minutes to work, it shows up as an entirely driving trip. A number of people have suggested that this single mode constraint over-emphasizes the mode share for driving and therefore underemphasizes walking, bicycling and transit.

I will be looking at the National Household Travel Survey, last completed in 2009, to see how it compares to the American Community Survey. There is also a California Household Travel Survey, which looked at things is a much more detailed manner, but did not provide anywhere near the coverage of a census, sampling only typical parts of the state in detail.