The MUTCD is an incredibly complex document, with cross-references everywhere that require you to jump around through the document, terms used but never defined (though 287 terms are defined), incredible detail on some topics while pretty much ignoring other topics (like bicyclists and walkers). The document is intended to cover signs and markings (the paint on roadways) but does not address roadway design except in a very minor way. That is deferred to private organizations such as Association Association of State Highway and Transportation Officials (AASHTO). Many people have suggested that the main reason FHWA is updating MUTCD is to add the section on automated vehicles, and the other changes are an afterthought.
One could devote their life to reading and understanding the MUTCD, and probably would not, in fact I’m not sure that anyone in FHWA has ever read the entire document. The reason it is so important, however, is that it is the document to which transportation engineers constantly refer to as the reason they can’t do the right thing, or must do the wrong thing.
My comments so far are below.
The MUTCD should be separated into two documents, one for highways and another for streets. Local engineers continually refer to items that should only apply to highways in designing or refusing to design facilities for streets.
Section 1C.02 Definitions of Words and Phrases Used in this Manual 106. Intersection—intersection is defined as follows: (b) The junction of an alley, or driveway, or side roadway with a public roadway or highway shall not constitute an intersection, unless the public roadway or highway at said junction is controlled by a traffic control device.
The definition uses the term ‘side roadway’ but this term is not otherwise defined. If used, it must be defined.
2B.59 Traffic Signal Pedestrian and Bicycle Actuation Signs (R10-1 through R10-4, and R10-24 through R10-26) Figure 2B-26. Pedestrian Signs and Plaques of the signs document The activation signs in 2B-59 should be greatly simplified. There should be a sign for signal heads that count down, a sign for symbols only, a sign to activate audible message, and a sign to extend crossing time. Having 18 signs does not help pedestrians in any way. Signs reflecting old pedestrian signal heads should be phased out in five years, along with changing all pedestrian signal heads to reflect the current standard.
4I.05 Pedestrian Detectors Push button pedestrian detectors which are not required (the signal is on auto-recall) SHALL be removed, or converted to accessible pedestrian detectors, within five years of the date of publication. Accessible push button detectors will have associated signing which clearly indicates the purpose of the button, and that a button press is not required to cross. The existence of push buttons which serve no purpose is confusing to pedestrians and indicates a bias against people who walk.
Figure 4I-4 Pedestrian Intervals In the Relationship to associated vehicular phase intervals: diagram, the third option (Part of Yellow Change Interval + Red Clearance Interval = Buffer Interval) and the fourth option (Red Clearance Interval = Buffer Interval) should be removed. These two options may significantly reduce safety for pedestrians while having only minor impact on traffic throughput. These types of signal setups discourage people from crossing streets.
Part 6: Temporary Traffic Control
The entire Part 6 Temporary Traffic Control is extremely weak in the accommodation and protection of pedestrians and bicyclists.
Bicycles
Figure 6P-48. Bicycle Lane Closure with on-Road Detour (TA-48) Whenever construction signs are placed in a bike lane, as they often are, the ‘bike lane closed ahead’ sign should precede the ‘road work ahead’ sign, since bicyclists will be forced into the roadway by the sign and motor vehicle drivers need the warning of bicyclists before they need the warning of road work.
W11-1/W16-1P assembly is shown on the figure, but the sign is not in associated sign document. The ‘bike lane closed ahead’ sign is not in the associated sign document, nor does it seem to exist anywhere in the current MUTCD.
The ‘bikes may use full lane’ (R4-11) and the ‘share the road’ assembly are shown as optional. They should not be optional, since the detour roadway does not have a bike lane, whereas the construction roadway did.
Figure 6P-47. Bicycle Lane Closure without Detour (TA-47) Again makes the ‘bikes may use full lane’ and ‘share the road’ assembly optional. It should not be. Signing in this situation must communicate to both the bicyclist and the motor vehicle driver. The ‘bikes merge’ sign is not in the TTC signs document, nor anywhere else in the MUTCD.
There is no diagram that shows signing and marking for a temporary separated bicycle pathway placed in the roadway. There must be a diagram for this situation.
Pedestrians
Almost nowhere in the TTC sign diagrams are sidewalks shown nor the appropriate treatment of temporary closures, whether through detour or added pathways. The implication is that pedestrians don’t exist and need not be accommodated.
Figure 6K-2. Pedestrian Channelizing Device shows how a channelization should be constructed, but says nothing about where that channelization might occur.
Figure 6P-29. Crosswalk Closures and Pedestrian Detours (TA-29) shows sidewalk closures, with a mid block temporary crosswalk, but it does not show the barriers themselves, nor are these sidewalk barriers shown anywhere in the MUTCD so far as I can determine. Transportation agencies routinely use inconsistent signing and barriers for sidewalk closures, which is just as much of a hazard as inconsistent roadway signing, so this must be addressed in the MUTCD.
A diagram should be added that shows a pedestrian channelization placed in the roadway to provide safe and direct travel for pedestrians, in addition to the detour situation.
There is a pandemic of red light running in Sacramento, and probably everywhere else. There have always been some red light runners. But since the pandemic emptied many streets of prudent drivers and left them wide open to egregious violators, the problem is much worse now. I am not talking about drivers who ignore or speed up on yellow, and are still in the intersection when the light turns red, I am talking about drivers who enter the intersection when the signal is already red. Often, they speed up approaching the intersection, guaranteeing that any crash will be more serious.
I know many people will not believe this, or will offer up one of many windshield perspectives on why this is not really a problem: bicyclists run red lights all the time and pedestrians jump into the street, so that crashes are their fault and not the fault of the driver. Bullshit. This is an intentional behavior by people who know that they are driving in a dangerous manner, but think they’ll get away with it. And they often do, since other drivers and walkers and bicyclists mostly know not to enter an intersection without looking to see if any of these criminals are coming.
So, if you are a doubter, I ask that you spend time observing a busy or moderately busy intersection. It probably won’t take more than 10 minutes before you see someone run a red light. This behavior truly is pandemic.
One of my observations is that about 2/3 of these are drivers of high value cars, BMWs and huge pickup trucks being the worst offenders. These people, in the unlikely event that they get a ticket for their violation, probably just see this as a minor expense for driving the way they want to. If you don’t believe that the drivers of different kinds of vehicles behave differently, please see Driving Drunk: Car Models with the Most DUIs.
A walker who steps off the curb when the pedestrian signal gives them the right of way are significantly more likely to be hit, or narrowly avoiding being hit, by these criminal red light runners. Same for a bicyclists or other drivers who enter the intersection when the light tells them it is their turn. The situation is slightly different for walkers, who do have the right of way, and bicyclists and drivers, who can enter the intersection when it is safe to do so. But in all cases, the violator is endangering the lives of others.
Red light running is a behavior that is certain to result, sooner or later, in serious injury or fatality. As such, it should be a high priority for enforcement. Both red light cameras and on-the-ground enforcement are needed, and must continue until this criminal behavior recedes at least to pre-pandemic levels, and then beyond that, until it is eliminated.
Some specifics:
red light running tickets should be based on the value of the vehicle, so that high income people with high value cars are penalized at a level that will actually change their behavior, and conversely that low income people are not penalized in a way that leads to a downward spiral
all red light tickets, whether camera or on-the-ground, must require an appearance before a judge; short-term suspension of the drivers license should be the default punishment meted out; repeated violations should result in permanent revocation of the drivers license and confiscation of the vehicle
law enforcement should prioritize observation of and enforcement of driver behaviors that are most likely to result in serious injury or fatality; these behaviors in my mind include egregious speeding (more than 20% over speed limit), failure to yield to pedestrians in the crosswalk, and of course red light running; CHP really only cars about speeding, but this must change. Other law enforcement agencies are more likely to pay attention to other violations, but still not enough.
Some places have red light cameras to catch red light runners, but many places do not. The City of Sacramento has eleven locations with red light cameras, out of about 900 intersections. Sacramento County and the City of Citrus Heights have cameras, but I’ve been unable to find locations or numbers. Rancho Cordova has four locations. The City of Folsom apparently has none.
The City of Sacramento Downtown Mobility Project includes the conversion of two one-way street segments to two-way. Specifically, I Street from 15th St to 21st St, and 5th Street from I St to X St. The time frame for these changes was projected to be 2021.
Note that 5th Street is already two-way from L St to J St, and from I St to Railyards Blvd. One-way 5th Street significantly handicaps access from the south to and from Sacramento Valley Station.
Downtown Mobility Plan
The 2040 Sacramento General Plan mobility element Proposed Roadway Changes map (10MB; this is from the City Council agenda item 15 for January 19, 2021, I’ve not found it on the city website) indicates additional one-way to two-way conversions in the central city. On the clip of the city-wide map showing the central city, below in pinkish, these are small sections of 3rd St, sections of 7th St and 8th St, one block of 16th St, small sections of 19th St and 21st St, sections of G St and H St, some additional sections of I St, a long section of N St, and small sections of L St and P St under the Business 80/Capital City freeway. There is no indication of sequencing of these conversions in documents available so far, but since the plan is a 20 year plan, I would hope that these conversion are prioritized for the next five years.
2040 Sacramento General Plan, Proposed Roadway Changes, excerpt
I’ve written a number of times about the safety hazards of one-way streets and recommendations for converting them in Sacramento: One-way streets, again; 5th Street mess at Sac Valley Station; more on conversion to two-way streets; street changes. When these additional conversions are implemented, the central city will be closer to my ideal of no one-way streets except when there is a separated (protected) bikeway on the street. An even this is questionable, as it increases safety for bicyclists but does little to increase safety for walkers.
Someone recently asked when the streets in the central city were converted to one-way, and I don’t know. Anyone out there have information?
The agency has many areas of responsibility including vehicle safety and education. The agency mission is: “The National Highway Traffic Safety Administration is responsible for keeping people safe on America’s roadways.” The agency has for years (long predating Trump) seen its mission as making it safe for people inside vehicles, and has ignored any issues of safety for people outside vehicles. People have repeatedly asked that the agency address vehicle design that would make it safer for people outside, making it less likely that they would be hit by a driver, and more likely to survive if they were hit. Its education programs are rife with victim blaming and bias against walkers and bicyclists. Nearly everyone who is active in the walker and bicyclist safety profession rejects out of hand their educational materials as being so biased as to be unusable. Even though they have officially stopped using the discredited claim that driver behavior is responsible for 94% of crashes, they are still relaying and cheering on this garbage when other agencies and organizations use it.
NHTSA has promoted the ‘shared responsibility’ mythology, that all users of the road are equally responsible for safety, frequently seen along with the message that walkers and bicyclist must wear high visibility clothing, must carry lights, must never use cell phones, must be aware at all times of the hazard presented by motor vehicles and are responsible for avoiding those hazards. This is bullshit. Drivers of vehicles which are designed to be unsafe for people outside them, who think they own the road and that pedestrians and bicyclists should be somewhere else, should be responsible. These drivers are traveling along roadways that were designed to be unsafe for walkers and bicyclists by transportation agency engineers, who also should be responsible.
NHTSA does not have responsibility for roadway design, that lies with the Federal Highway Administration (FHWA). However, NHTSA has made no effort to work with FHWA to bring together concerns about the safety of vehicle design with the safety of roadway design. The agency view seems to be ‘not our problem’.
I encourage you to read Don Kostelec, who has been one of strongest voices highlighting the victim-blaming of agencies like NHTSA and the mis-design of roadways by engineers. He does a better job of this than I ever could.
20% of roadway fatalities in 2019 were what NHTSA calls ‘nonoccupant fatalities’, meaning people walking and bicycling. Or eating in cafes, or sleeping in their beds, or shopping in stores, or any number of other ways in which drivers kill people when departing the roadway. During the pandemic there has been a huge increase in poor (criminal) driver behavior, and after the pandemic there will be a large increase in vehicle miles traveled (VMT). In some places, vehicles miles traveled (VMT) has already increased nearly back to where it was before the pandemic, even though many people are taking few or no trips. Those who are taking trips have increased their motor vehicle use. This does not bode well. NHTSA does not directly contribute to this problem, but it has had a central role in absolving drivers of responsibility for crashes that kill and maim walkers and bicyclists, and for that, I hold them responsible.
7,338 walkers and bicyclist died on the roadways in 2019. The numbers will probably be similar in 2020, though some cities have seen huge increases. Ironically, the percentage of total fatalities may decrease since there has been such a huge increase, of about 1.5 times, in single vehicle crashes, mostly due to speeding. (https://crashstats.nhtsa.dot.gov/Api/Public/Publication/813054)
I don’t think that NHTSA can be reformed. The culture of windshield perspective and victim blaming is so deeply ingrained in the agency that, short of casting off all the administrators, department heads, and much of the employee base, no reform is possible. While other agencies and organizations at all government levels have shifted away from victim blaming and windshield bias, many kicking and screaming, NHTSA has not shifted. It is still stuck in the 1970s mindset that plagues transportation agencies, that the purpose of roadways is to move the maximum number of motor vehicles at the maximum possible speed.
So, Steven, I wish you the best of luck and professional success in this position, but I’m not holding my breath. The anti-safety culture is just too deeply embedded in NHTSA. Of that 7,338 people who died in 2019, I would guess that half of them would be alive today if NHTSA actually took its stated mission of roadway safety seriously.
I started wondering about other variables that might affect pavement condition index (PCI) in the council districts, so here is a little more exploration. See the previous post: pavement condition in Sac City.
First, the council district map, for those who may not be familiar with boundaries.
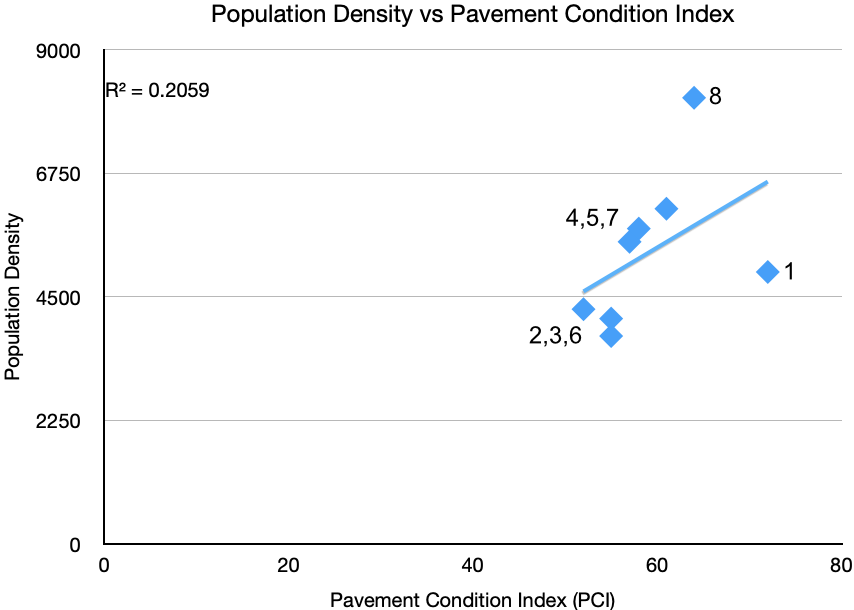
I wondered about the relationship between population density (people per square mile) and PCI. There isn’t any correlation, though again, the district 1 and 8 outliers may be interesting. I did not realize that district 8 has the highest population density of the districts.
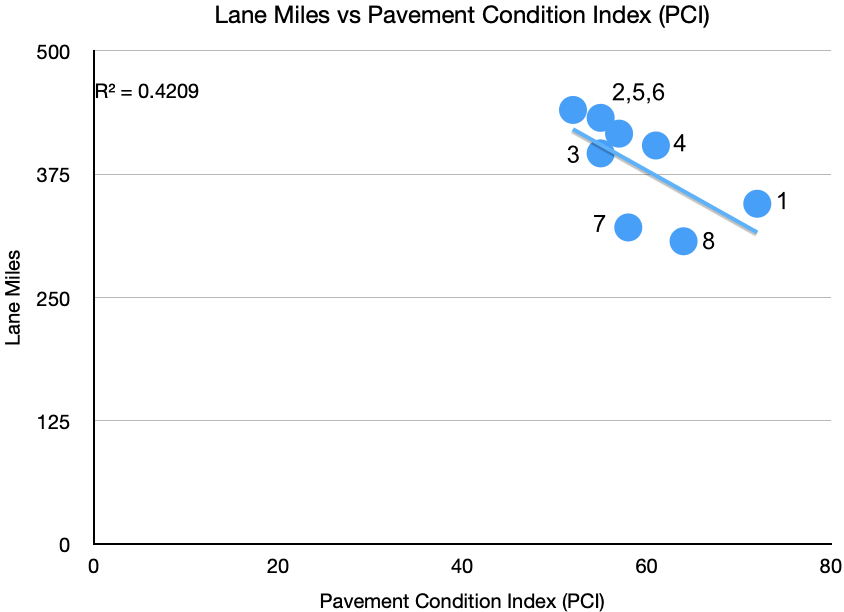
I wondered about the relationship between lanes miles and PCI. There is a weak correlation.
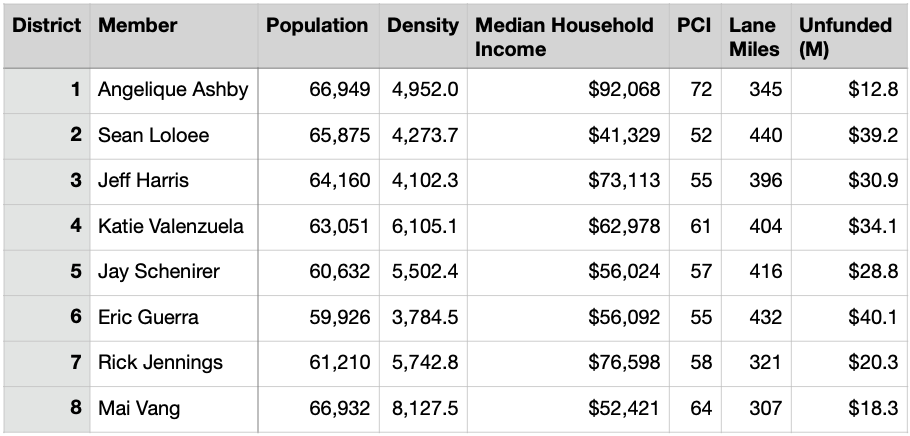
And finally, here is my current data table, in case you want to play with data or suggest insights. Note that the population of each district is roughly the same, as it should be. The unfunded column is the amount (millions of dollars) of backlog, to bring roadways up to PCI 75, but it does not include the ongoing yearly expense of maintaining them at that level.
In the search for other information, I came across the City of Sacramento Pavement Condition Report, dated March 2020, and it has some interesting things to ponder. The city has 3000 lane miles of streets. The county reports road miles instead of lane miles, so I can’t directly compare the city and county, but the city does say it has the fifth largest roadways network in California.
The report has maps for each council district, showing the PCI for each (PCI = pavement condition index, a measure of how well the roadway has been maintained, higher is better). I wondered whether the PCI correlated with income, as many things do, so I plotted 2020 median household income of each district against PCI, table and chart below.
There is not a strong correlation between income and PCI, R = .42, but district 1 and 2 are clear outliers, with 1 being the highest income and highest PCI, and 2 being the lowest income and lowest PCI. The city report says that the reason district 1 has a high PCI is that the roads there are newer, but I’m a little doubtful this explains it all, since many of the roads in that area are now old enough to need maintenance.
The target score for ‘roads in good condition’ is at least PCI 75, so Sacramento is falling far short of that because it is not spending enough on roadway maintenance. Part of the reason for this is that money is spent on building new roadways and widening roadways instead of maintaining roadways. But the underlying reason is that the city has allowed to be constructed, and then taken on maintenance responsibility for, roadways which it does not have the income to maintain. In new developments, construction of internal roadways is paid by the developer, but arterials and collectors, which often must be upgraded to handle increased traffic, and the interchanges with freeways, are largely paid by the city, or grants, and are maintained by the city. But low density development, of which the city was formerly very fond and still has some attachment to, cannot ever generate enough income in property or sales taxes to maintain the roadways. This is one of the great suburban subsidies that so hurts our cities and counties.
The report lays out three funding level scenarios:
current funding levels: The PCI will deteriorate over 10 years to 42, which is rated ‘poor’, and if ever corrected, would cost about ten times as much to correct as it would to maintain. I doubt that most people in the city would find this in any way acceptable.
maintain current conditions: To keep the PCI level at 60, the city would need to spend $35.7 million per year, but it is currently only spending $9.7 million per year. This is 3.7 times current expenditures. Though the PCI would be stable, there would be a continuous increasing backlog of maintenance because the PCI would not be improved to the desired 75.
improve conditions to state of good repair: To bring PCI to 75 would cost $58.5 million per year. This is 6.0 times current expenditures.
What to do? I’m sure if the city knew, it might never have gotten into this bind. This is a pattern with nearly all cities, that they cannot under any reasonable current taxation scheme hope to maintain their infrastructure. This post is about roadways, but the same is true of water supply and sewer and electric and gas. And services such as fire and police, for that matter. And it doesn’t even touch on the need for sidewalk maintenance, which is only addressed in terms of adding ADA structures at intersections. For much greater insight on the problem and possible solutions, I refer you to Strong Towns and the book Strong Towns: A Bottom-Up Revolution to Rebuild American Prosperity (from your local bookstore or library).
But I will suggest some things:
a moratorium on accepting any new roadways into the city, until the city has identified a mechanism for maintaining them, which would probably entail the developer paying into a trust fund for maintenance
paving of parking lanes to a lower level of maintenance than travel lanes; adjacent areas do not need the load bearing capacity of travel lanes nor receive as much wear and tear; the city has already done this in a few locations
reducing excess travel lanes; for most roadways in the city, three travel lanes per direction are excess capacity, rarely needed except for brief periods of time or in uncommon circumstances; though re-allocation to bike lanes, separated bikeways, or sidewalks (or in a few cases, parking) should be the ultimate fate of these excess areas, in the meanwhile they can just be blocked off from use and therefore remove the need for maintenance; in many cases two lanes per direction are also excess
evaluate whether a lower PCI than 75 might be just fine for residential streets and collector streets; after all, poor pavement does have a traffic calming effect, and we need traffic calming everywhere, so maybe PCI 60 is OK for many roadways
I believe that funding to maintain local streets, most of which are residential streets, and probably collector streets, should come from the city or county level, not from the state or federal government. The closer to the roadway the funding is, the more likely the city or county is to make rational and sustainable decisions about roadway maintenance responsibilities and funding. I think an argument could be made that arterial maintenance should be funded by the state since these roadways serve traffic beyond the city and county boundaries.
As a car-free person, you might assume that I don’t care much about pavement condition, but buses and bikes operate on the same streets as private motor vehicles and commercial vehicles, so acceptable pavement condition is important to me as well.
Following the online virtual open house, I realized I could not picture the situation on some segments of Stockton. Though I’ve traveled Stockton many times, I had not in a while, so I went back. I had commented during the open house, as well as after, that I didn’t think the cross-sections presented gave enough information on or weight to trees, so that was part of my agenda, to see the tree situation better. The day I went, last Sunday, was one of the cooler days in a while, high of 80 degrees Fahrenheit, but on the street the lack of shade and heat was noticeable. Add 20 degrees, and it would be intolerable for walking and unpleasant for bicycling.
The tree situation is not good. There are some sections with healthy trees, and some places where trees on commercial properties are healthy and shade the sidewalks, but on the whole, trees are lacking. The first photo below, taken looking south, to the south of Broadway, shows a long section with no trees at all, no buffer, no shade. The sidewalk is wide enough, but who would want to walk here?
Stockton Blvd south of Broadway
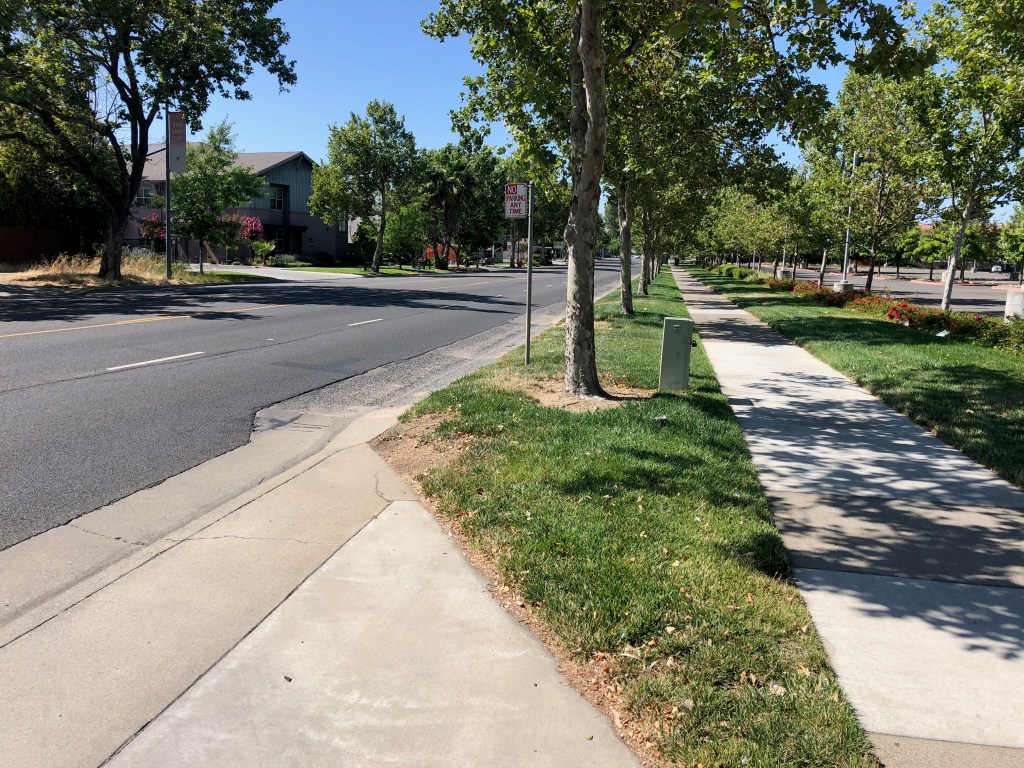
The next photo is of the section adjacent to UC Davis Medical Center where trees are present in a slightly too narrow buffer. The trees are relatively young, but when mature, will provide necessary shade and probably also crowd the buffer.
Stockton Blvd near UC Davis Medical Center
The next photo is of a very narrow strip where trees were present but were all cut down, and the following photo, a Google streetview capture of the trees. The trees were obviously planted in a strip far too narrow for them, and some of them were unhealthy as a result, so I’m not presenting this as a model, but as a warning that commercial properties cannot be relied upon to provide trees. Even the small trees in this narrow strip provided some shade and feeling of place to the street. In addition to this instance, there are many commercial properties and some residential properties along Stockton where the trees are dying, dead, or have been removed. And conversely, some where the trees on commercial properties are in good condition, so thank you to these properties. Trees, if they are to serve as a long-term amenity, as I believe they should, must be provided in the public right of way and maintained by the city.
Stockton Blvd, removed trees, near JansenStockton Blvd, trees before removal, near Jansen
A small archive of photos from Stockton Blvd are available in the Flickr album at the end of this post, and those who live along or do business along can provide more detail.
So what is the solution? The first part of the solution is that the city must modify its cross-section renderings and pages so that it highlights the tree situation. Will there be a sidewalk buffer? How wide? What numbers and kinds of trees? To what degree will the project rely on trees on private property, versus trees in the public right-of-way? I find the options presented as unacceptable because they don’t really address this issue. On a few of the pages, trees are mentioned, but never in enough detail.
I would propose for community along Stockton Blvd that there should be continuous sidewalk buffers planted with trees, all the way from Alhambra to 47th Ave/Elder Creek Rd. Where buffers are present with trees, great, make sure they are preserved and cared for. Where buffers are present but the trees are absent or unhealthy, plant new trees and care for them. Where there are no buffers, create them, and plant trees and care for them. Where there is a healthy tree line on private property, this can serve for now, but the buffer should still be provided for the protection of walkers and as a bulwark against possible abandonment of the private trees. I envision Stockton Blvd being a tree-lined community asset, where walking is a pleasure and traffic speeds and volumes are low.
For new buffers, the minimum width of the buffer should be eight feet, as anything narrower does not allow for full development of the trees, and leads to excessive root heaving of the sidewalk. The heaving is to some degree an inevitable consequence of having trees, but wider buffers and correct watering regimes reduce the problem considerably. Where the existing buffers are at least six feet and the trees are healthy, the buffer can be widened or left as is, depending on the situation. Where the buffer is narrower than six feet, the buffer must be expanded.
Where commercial businesses are present and buildings meet the sidewalk, the trees should still be present, but the spacing and species can be adjusted in consultation with the property or business owners so that they don’t block off visibility of local businesses. In most cases the buffer would be paved, with tree wells for the trees, and street furniture or other amenities in the buffer, but the buffer would still be a minimum of eight feet.
Intersections
Another issues that the city diagrams and information do not address is intersections and crossings. The existing conditions report acknowledges that there are long distances between safe crossings on the south end, but doesn’t provide much detail about intersections.
The intersections as they exist actively discourage pedestrian activity. The midblock crossings, of which there are a few, do not have any additional protection. At a minimum, these locations need user-activated RRFBs (Rectangular Rapid Flashing Beacons). At many of the signalized intersections with minor streets, there is a pedestrian prohibition on either the north or south leg. These prohibitions exist solely to speed the signal cycle and encourage traffic flow; they do not exist for safety reasons. They must be removed. The photos below shows just one of the many such prohibitions. A person walking on the south side of Jansen, wanting to go south on Stockton, would have to use two crosswalks, waiting for the signal, and then walk through an overly wide commercial driveway. There is no reason for this.
Stockton Blvd at Jansen Dr, pedestrian prohibition
At the major intersections, where crosswalks are present on all legs, the crossing distances are long. Though not as bad as many other locations in Sacramento, intersections are often flared out to add turn lanes, both left and, often, right turn lanes. This increases crossing distance. This issue can be solved in two ways: removing the unnecessary turn lanes, or adding pedestrian refuge islands in the middle, so that slower walkers can make the crossing in two stages. The medians must be six feet wide, to meet standards, and must have a pedestrian button so that people don’t become stranded. (Note: I’m not in favor of pedestrian buttons at all, except when they: 1) trigger audible information, or 2) lengthen the crossing time; however, this is one situation in which they make sense)
The project information does not really address intersections at all. City staff said that these details would be worked out later, but I find this unacceptable. Intersection design must be part of the options presented. Intersections are where most conflicts occur between pedestrians and vehicle drivers, and bicyclists and drivers as well, so they are a critical element of any effort to improve Stockton.
Driveways
Some of the sections of Stockton are littered with driveways. Each commercial property has one to several. Part of improving Stockton must be to reduce the number of driveways. Each commercial property should have one driveway, or less. One of (the only) advantages of the parking moats that front the street (what I mean by parking moat is that the commercial buildings are set back away from the street, and parking lots face the street; these parking moats contribute significantly to the feeling of Stockton Blvd being a car-dominated place). In several cases, these parking moats can be combined for several properties in order to reduce the frequency of driveways. The issue with driveways is that they not only make a place feel busy and unwelcoming to walkers and bicyclists, but they are safety hazards for walkers and bicyclists very nearly as bad as the hazard of an intersection.
Stockton Blvd, north of Elder Creek, excessive driveways
Built Form
There is a section of ‘old’ Stockton Blvd where the buildings come to the sidewalk, and parking, if any is to the side or back. This traditional pattern (traditional before suburban sprawl) is the best built environment, the one that feels most welcoming to people outside cars. It increases customers, it makes the street feel smaller and the sidewalk feel larger.
The ‘new’ sections of Stockton Blvd where buildings are set back behind a moat of parking have exactly the opposite effect, producing an environment that feels unwelcoming to walkers, makes the sidewalk feel like a part of the street rather than a part of the neighborhood. This built form is a widely recognized mistake, but the correction will take many, many years as these commercial properties evolve. But what can happen, now, is that all new commercial buildings can be required to front the sidewalk. There are a lot of empty or abandoned parcels on Stockton, which everyone hopes will see new development. That development should be the traditional pattern that gives the street a neighborhood feel rather than a traffic sewer feel.
Stockton Blvd, buildings fronting the sidewalk
Speed Limits
Another issue that the study pays scant attention to is speed limits. Whether or not the street design option work depends on design speed and posted speed. The default assumption in transportation planning is that speed limits cannot be lowered, due to California ‘law’. First, it is not a law, it is case law, established by judges, not the legislature, that says traffic tickets won’t be enforced unless speed limits are set to the level at which only 15% of drivers exceed. This will of course be changed, but the process is long, with powerful opponents, most specifically CHP whose lip service to safety is legend. But more important to this study is that streets that are reconfigured, with a change to lane width or number of lanes or mix of modes, can be set to any speed limit the city wishes. The road is new, and the past speed limit doesn’t apply.
So, in accordance with my desire to see a tree-lined neighborhood boulevard, I think that the speed limit for this entire length should be 30 mph. And of course the street must be designed to enforce that posted speed limit.
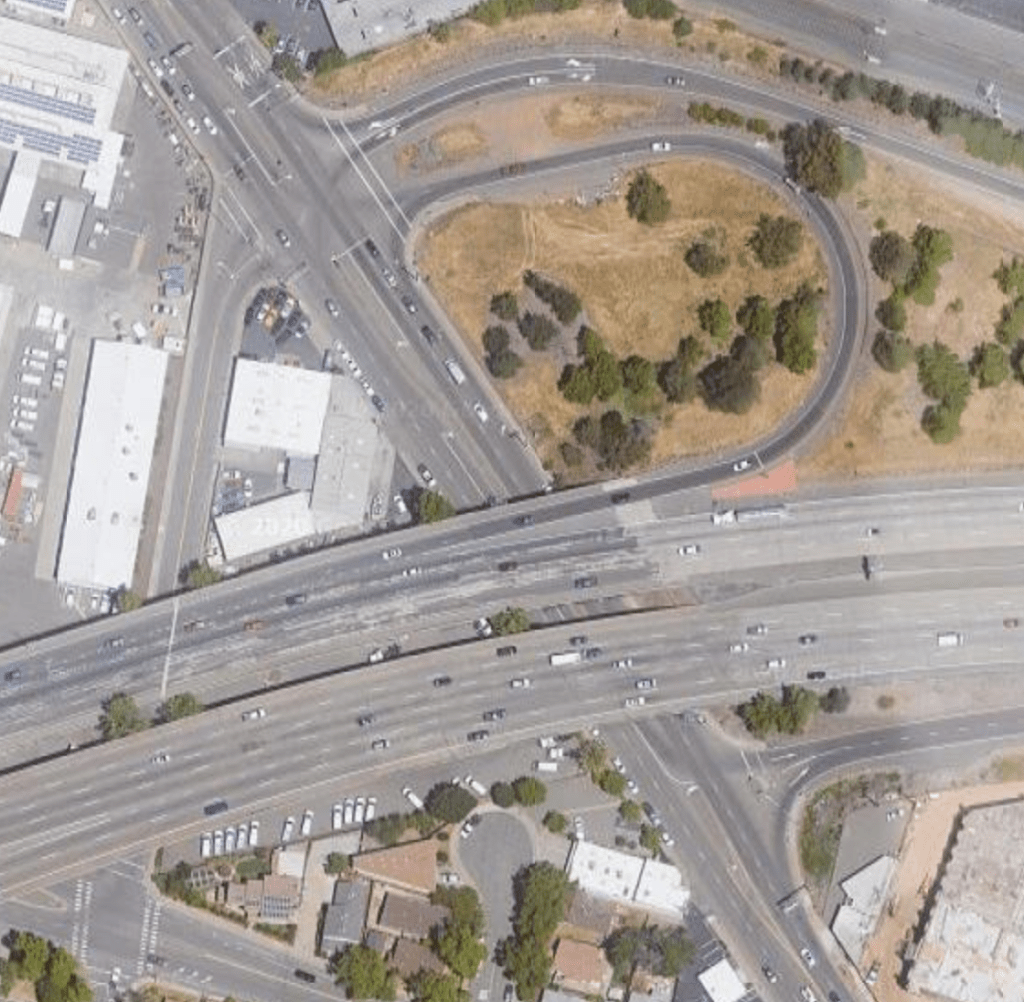
Highway 50 Interchange
The Hwy 50 and Stockton Blvd interchange is problematic for both walkers and bicyclists. There are no bike lanes through this section, at all, and walkers on the east side of Stockton face long crossing distances in a design that strongly favors high speed motor vehicle drivers. In the photo below, look at the long crossing distance on the north side of the freeway, of the exit and entrance ramps. It’s about 120 feet, with no protection from drivers, at all. I have both used and observed this crosswalk, and can confirm that very few drivers yield to walkers in the crosswalk. It is a guaranteed death trap for walkers.
The roadway striping does not delineate areas for motor vehicles and bicyclists, nor does it indicate where riders or drivers should be merging to reach their destination. It is just a wide-open area, and as with all wide-open areas, drivers will assume they have complete right-of-way. You can see by the tire tracks that the turns on and off the freeways are being taken at high speed.
Stockton Blvd – Hwy 50 interchange
This interchange must be completely reconfigured for the safety of walkers and bicyclists, and drivers for that matter. The entry and exit ramps must connect with the street at 90 degree angles, requiring drivers to make low speed turns. Bicycle lanes with green conflict markings must be installed throughout the interchange. Sidewalks must be improved and crossing distances shortened to no more than 22 feet.
It is disappointing that such a critical safety hazard was not addressed in the study.
Mode Share
The study, online survey, and open house never address the key issue for the entire corridor, which is: what should be the priority of travel modes in design of the street? Some of the options imply a higher priority for some modes than others, but the critical question is never asked of the public. I had said in my previous post that my priorities would be transit first, then walking, then bicycling, then private motor vehicle travel. However, having spent more time looking at and thinking about the corridor, I’m going to change that. The priorities should be walking first, strongly supported by the tree-lined boulevard configuration I’ve outlined and justified, then transit, then bicycling, then private motor vehicles.
What is is important here, though, it not my preference, but that the public, and in particular the residents and customers along the corridor were never asked this question.
What Now?
I’ve laid out what I consider some major flaws in the study. I am not against the particular options that were presented, and from that limited perspective, the study has done a good job. But the number of things NOT considered is glaring. I know the city hopes to address these issues later, but I don’t find later to be acceptable. The public needs a full set in information now, so that it can comment on the study from a perspective of understanding how the street will feel after the changes, not just design diagrams, but how each traveler will get along and across the corridor, and whether it supports their desires for mobility and livability.
I think the city should pause the study process and add in the elements not addressed, then go back out to key stakeholders, and re-do the engagement process including the survey and open house.
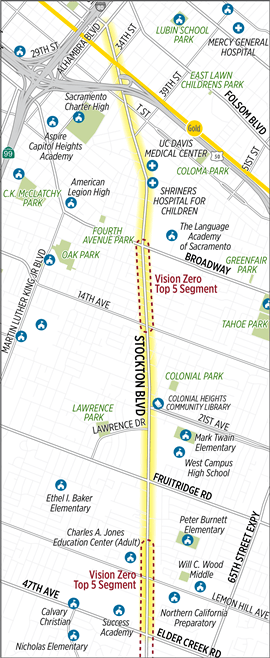
The City of Sacramento is undertaking a Stockton Blvd Corridor Study, covering the section between Alhambra Blvd and 47th Ave / Elder Creek Rd, but focused on the two high injury segments around Broadway to 14th Ave and north of Lemon Hill Ave to south of 47th Ave / Elder Creek Rd. Map below.
Tomorrow, Thursday June 25, there will be a virtual open house at 6:00 pm. There is also a survey which is open through Tuesday, June 30. The survey offers existing conditions information for each of several segments, and then presents two options are asks the user to select one of the other, and make comments if they wish. The options were developed as a result of a community engagement process which was partially led by Jackie Cole of VG Consulting. I attended one of the meetings in February, which had more actual community members than most such meetings, but was only moderately attended. I did not attend any of the other events.
I would encourage anyone who travels on Stockton Blvd, and particularly people who live on or do business on the corridor to take the survey and attend the virtual open house. Please use the comment boxes to tell stories of your personal experiences and concerns using the corridor, as they make a huge difference in the design ultimately selected (we hope).
The nature and width of Stockton (both the street and the right of way) varies considerably over the length of the section, so there is not a single roadway design that can be used throughout.
The survey and background documents do not address the number of driveways along several sections of the road. In some places there are more driveways than not driveways, with each commercial property having one or more driveways. The density of driveways mean that most measures taken to make the street safer for walkers and bicyclists, and faster for transit, will fail. The city must reduce the number of driveways, whereever consolidation is possible. A key question which the survey never asks is what should be the priority of the different travel modes along the corridor. I would argue for:
transit
walking
bicycling …..
private motor vehicles
But your priorities may be different. The reason I place transit at the top is that SacRT Route 51, when highest ridership route in the entire system, runs on Stockton from Broadway to 47th Ave and beyond. This is the sort of ridership that would justify bus rapid transit (BRT) in most cities, and some of the options do ease bus travel but fall short of BRT. And of course people must either walk or bicycle to the bus, and so these two modes must come next. High quality sidewalks and bike facilities can ease these ‘first mile’ trips, and make it possible to reduce somewhat the frequency of bus stops, further speeding the bus.
The safety justification doesn’t hold water. The interchange itself has no fatal collisions and no severe injuries during the period of time analyzed (safety starts at about 9:56 in the video). The severe injury collisions are all outside the project area. The city is definitely trying to gaslight people on the safety issue. If the city were actually concerned about safety, they would be doing projects at the severe injury locations. But they are not. In fact, unnecessary projects like this one gobble up the funds that could be used to solve real safety issues. It is worth pointing out that this area is not a high priority in the city’s Vision Zero program. There are many, many areas in the city with far higher collision rates.
The information on bicycle and pedestrian improvements is very fuzzy. Nothing is indicated that to me makes is seem safer for either. More traffic means less safety, unless the safety improvements are substantial, and I just do not see that here. See DDI comment below.
The project points out rightly there there will be increased demand for travel as a result of residential, commercial, and public development in the Railyards and River District areas. But it makes no mention of other ways of solving the issue. Demand management? Never heard of it. The project simply accepts that traffic congestion will get worse if no infrastructure is built, so infrastructure must be built. Of course the EIR has to consider the no-build alternative to be legal, but the city is certainly not presenting that option to the public.
The project uses traffic delay through the interchange (on the interstate) to justify the project. The current traffic delay is due to the fact that commuter traffic has been encouraged by the provision of additional capacity on Interstate 5 to the south of the city, and on Interstate 80 east and west of the city. Of course things will get worse at this location, as more people commute and travel on this increased capacity. This is called induced travel, and is to be expected. Induced travel is increased by capacity expansion projects.
The city wants to spend $46 to $100 million of your tax money to ‘solve’ this problem. If we let them do that, they will be back in a few years with another project to ‘solve’ the problem at some other nearby pinch point, and the new project will be even more expensive because they have induced more travel by ‘solving’ the perceived congestion problem here.
It is time for us to demand that highways engineers be cut off from building new capacity. They see the taxpayer pockets as their piggy bank. Fix what we have, and invest the remaining transportation funds in supporting walking, bicycling, and transit.
The projects proposes making the interchange into a diverging diamond interchange (DDI), where the travel lanes switch sides under the freeway so as to reduce the number of intersections, and to ease common vehicle movements. Some people hate DDIs. Traffic and highway engineers love them. I’m pretty indifferent. I have spent a lot of time observing DDIs, before and after. They do offer some improvement in traffic flow, and they do offer minor improvement in safety for drivers. They are not any better or worse for bicyclist and pedestrian comfort and safety, IF they are designed properly (I’ve seen some very poor installations, some of which won awards from AASHTO, the highway lobby entity, that never saw an expensive project it did not love). It does take a period of a year or two for people to adjust to the different feeling of a DDI, but that is not necessarily bad. So my opposition to this project is not due to the DDI, but other issues. Others may feel differently.