For additional posts on Stockton Blvd, both the current STEP project and earlier iterations, see category: StocktonBlvd.
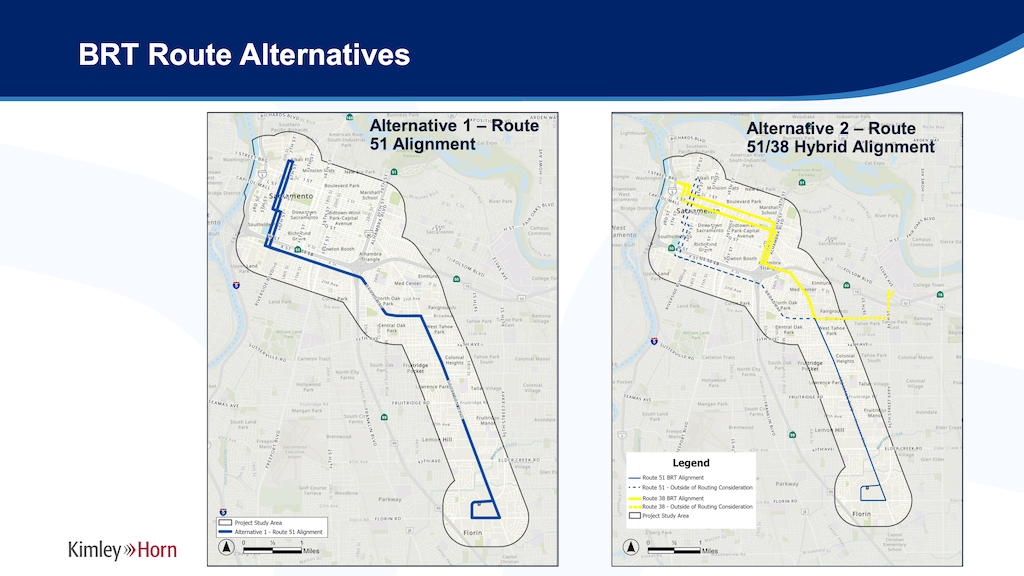
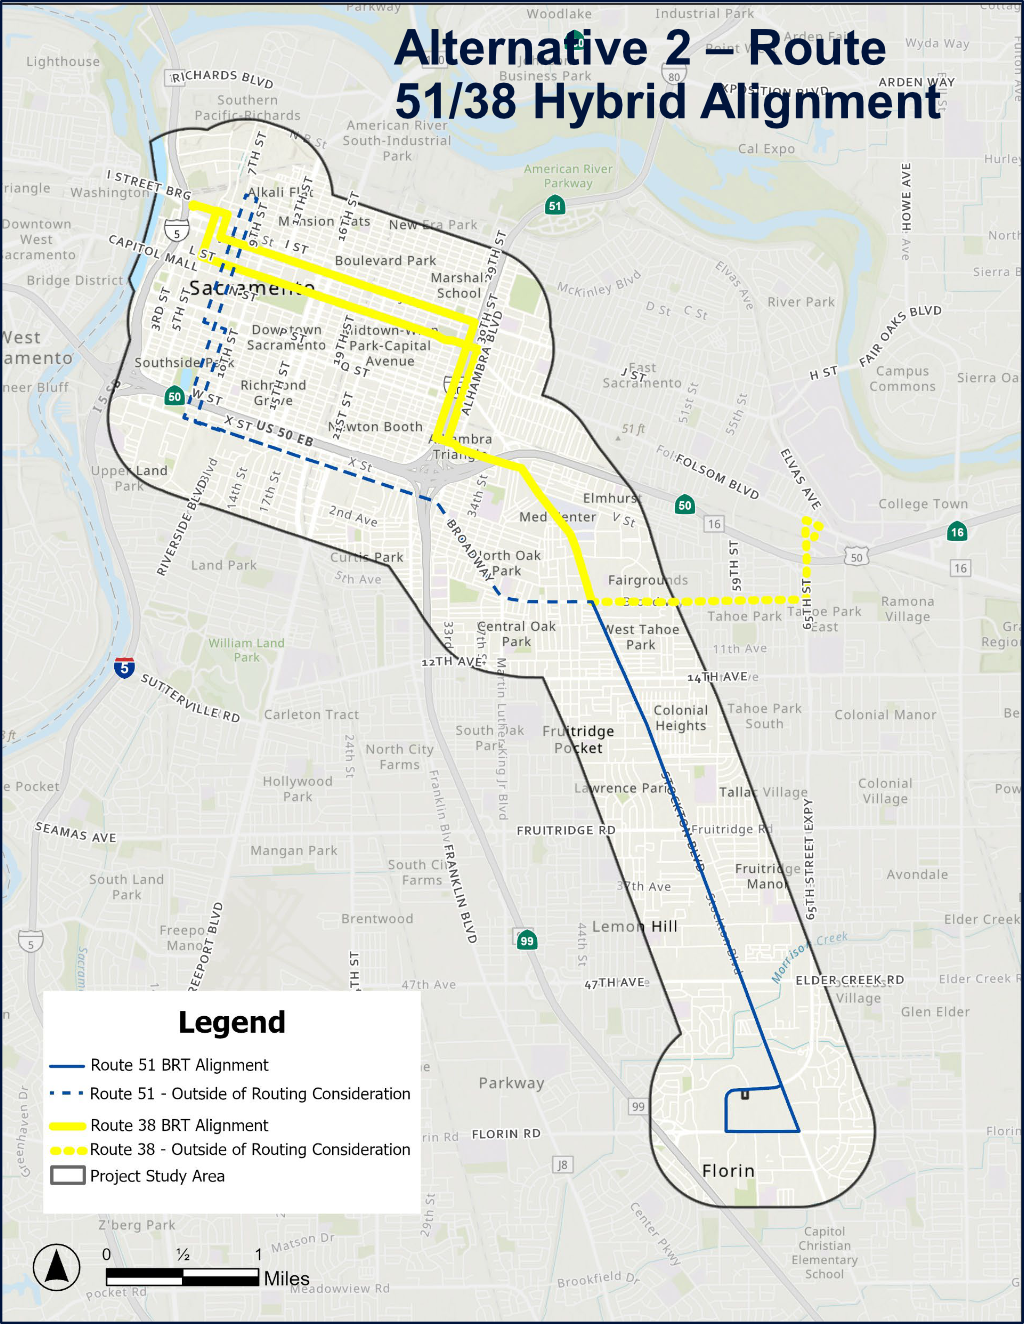
Part of the Stockton Boulevard Safety and Transit Enhancement Project (STEP) is consideration of changing the BRT (bus rapid transit) route north of Broadway to part of SacRT Route 38. In a presentation at the STEP stakeholder meeting on February 19, and in the similar presentation to SacATC on March 12, this alternative was presented by a slide (page 7) and additional discussion. That slide is below, followed by a slightly more detailed Alternative 2 – Route 51/38 Hybrid Alignment.
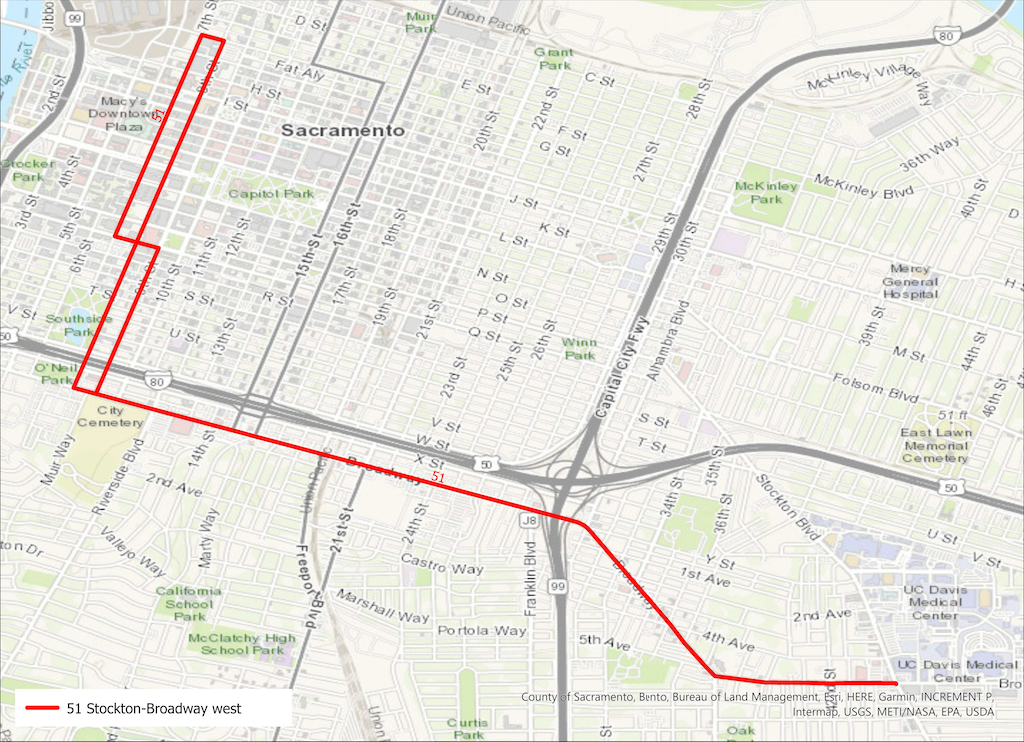
At SacATC, Commissioner David Moore raised the issue that the existing Route 51 along Broadway is also a very high ridership corridor, serving to connect equity neighborhoods to downtown and to Stockton. Replacing Route 51 high-frequency (15 minute) service with a moderate-frequency (30 minute) route, as Route 38 currently is, would be a disservice to these riders and raise major equity issues.
The segment of Broadway from Stockton Blvd to 8th/9th Streets, and probably into downtown, MUST have high-frequency (15 minute) service.
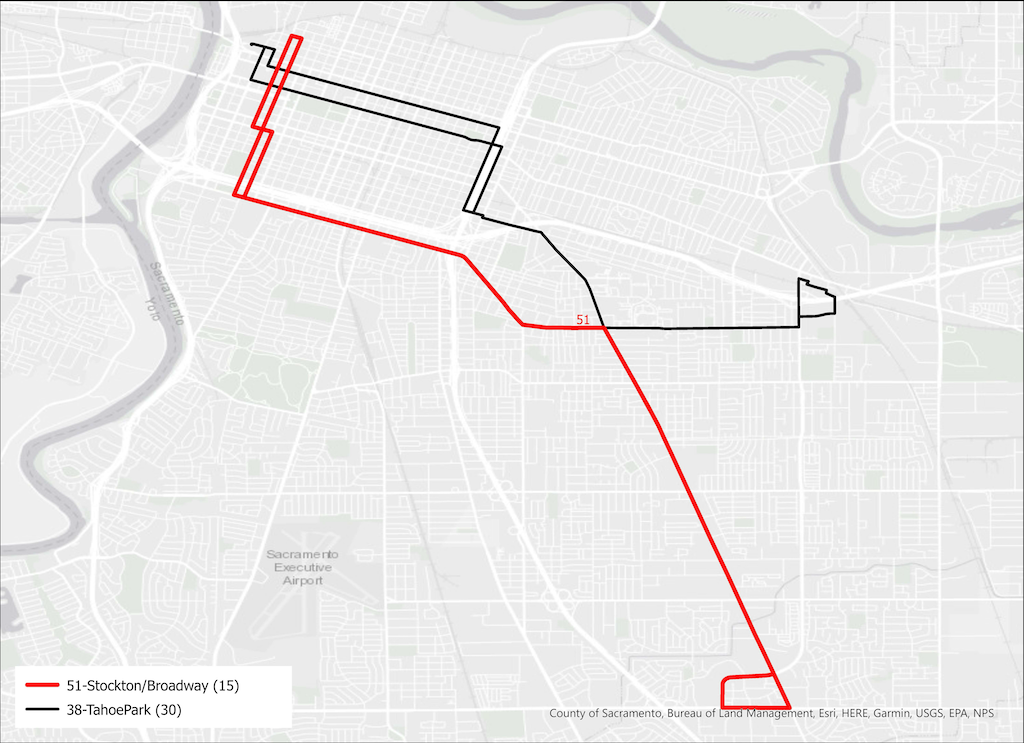
The two existing routes, 51 with a high-frequency (in SacRT terms, though this would be considered moderate frequency in major cities), and 38 with a moderate-frequency, are shown below (pdf).
Though it is not stated anywhere, the STEP alternative 2 map implies that the BRT route would end at Sacramento Valley Station rather than 8th St & F St as Route 51 currently does.
The western part of Route 38, which would become Stockton BRT under the alternative 2 51-38 hybrid, follows Stockton from Broadway north to T Street, then northbound on 30th Street or southbound on 29th Street, then west on L Street or east on J Street, and thence to Sacramento Valley Station.
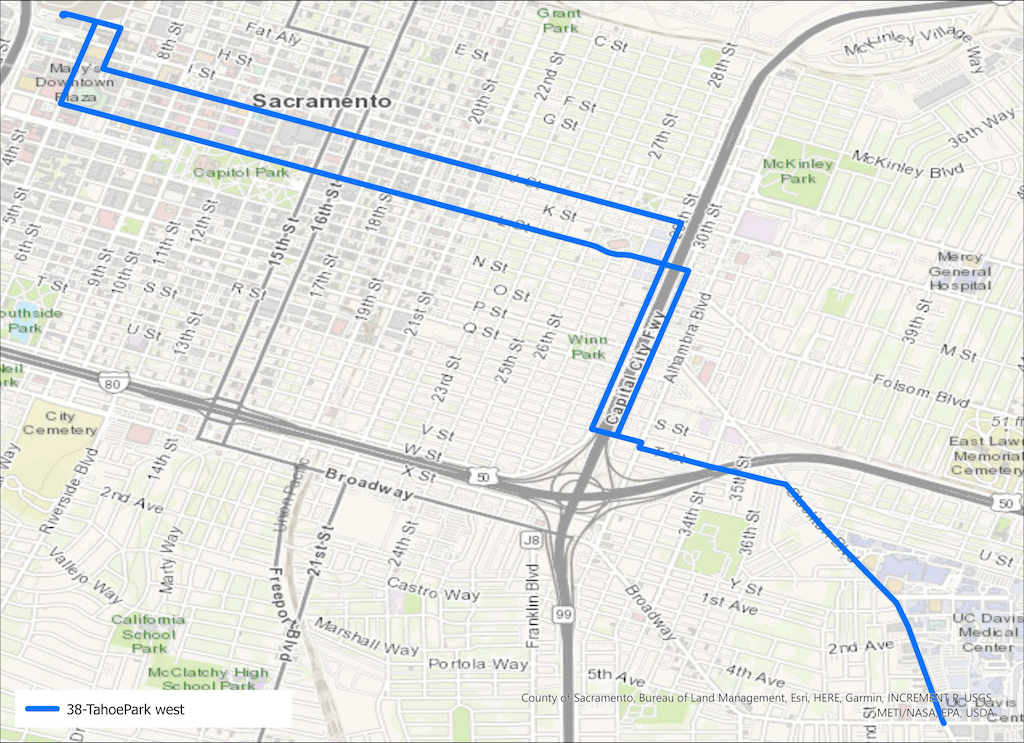
The west portion of the existing Route 51, from Stockton Blvd to 8th/9th Streets, is the segment that must have high-frequency (15 minute) to continue to serve the present high ridership. It is possible that this route would terminate at Sacramento Valley Station as well. It is unknown whether ridership on the existing Route 38 to the east, terminating at 65th Street light rail station, would also justify high-frequency service, and whether it this would be combined with existing Route 51 west. Map below (pdf).