Note: I decided I would map the proposed Automated Red Light Camera and SB 535 areas, and the map is at bottom. Note that SB 535 is not the only criteria for identifying disadvantaged communities, but it is the one most commonly used.
Item 03 on the SacATC agenda for 2026-08-20 is ‘Automated Red Light Camera Program’ (staff report | presentation). This is a new program being established under Senate Bill 720 2025 (SB 720, Ashby. Automated traffic enforcement system programs.). Though this bill did not eliminate earlier programs, the City of Sacramento does not currently have a program because they participated in a county-wide program which the county cancelled. The new program addresses many of the objections that had been raised to the older program.
I support this program, and these locations.
The staff report contains the map below.

I like the distribution of locations, though would hope for more locations. Maybe in time. The locations demonstrate two things: the equity concerns about concentrating red light cameras, and any type of enforcement, in low-income neighborhoods, does not seem to be a significant issue. Most of the locations are in moderate to high income neighborhoods. This fits with my observations that most red light running is by drivers of high-value motor vehicles, not low-income people. It would be interesting to map the intersections against disadvantaged communities, and probably the city did so, but I don’t have time for that, and the city did not provide it. (see below)
To some degree, I’m not sure how important the distribution of red light camera is. I strongly believe that the majority of red light running is by a minority, but a significant minority, of drivers. Many of these drivers run red lights all over the city. It is also contagious behavior. Yes, it is an epidemic, and the disease spreads though observation of other drivers behavior. It is a visual contagion. Though the enforcement mechanism here is civil and not criminal, it would allow Public Works to identify repeated and egregious red light runners, and pass that information along to law enforcement.
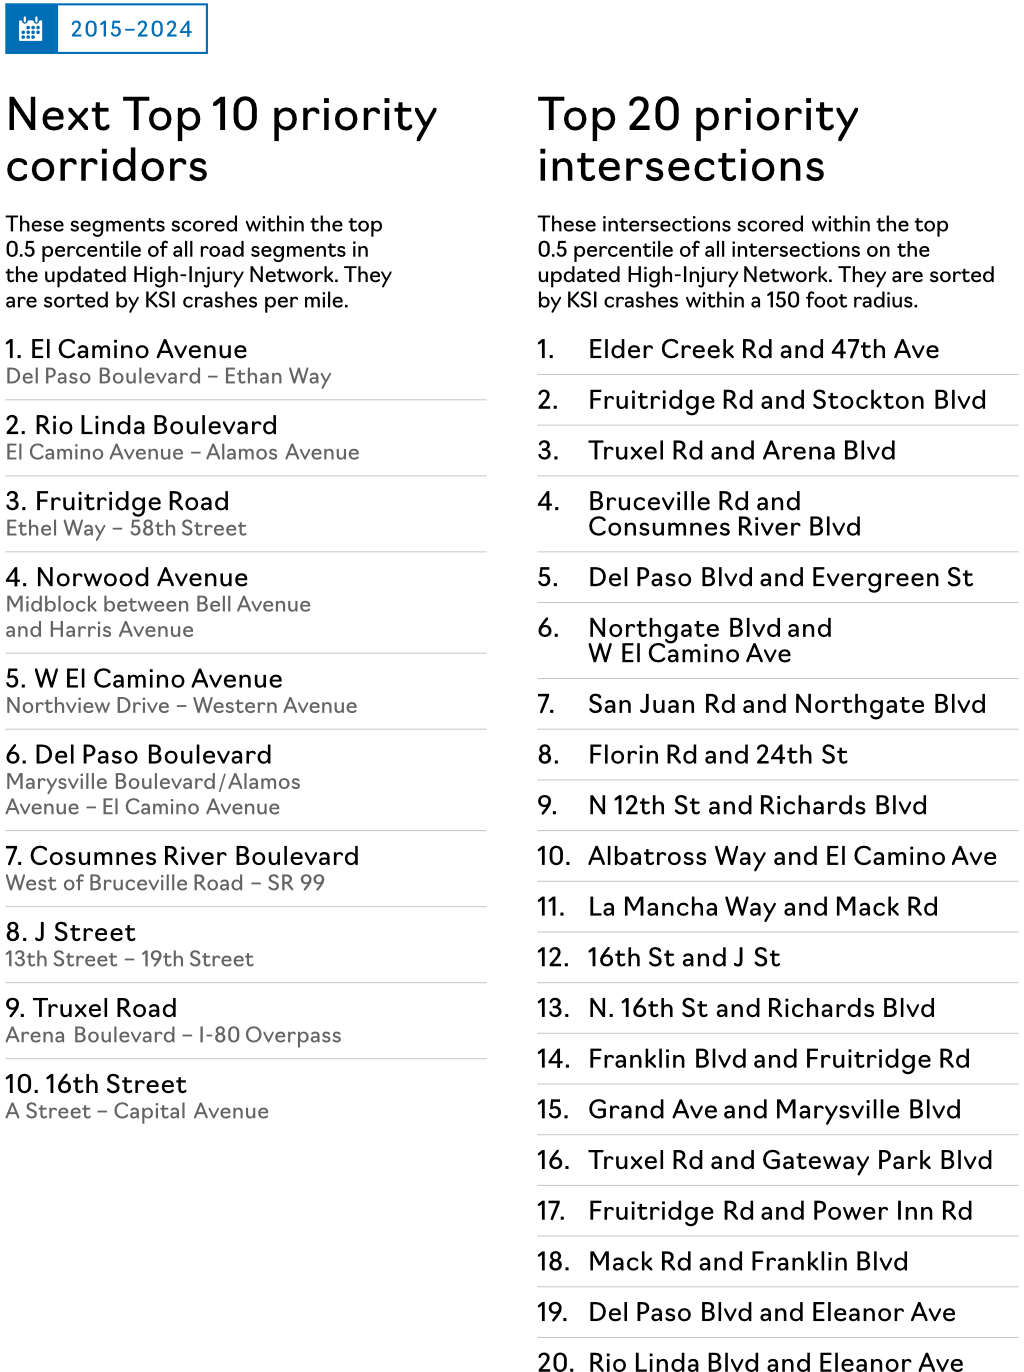
I was curious about how these 20 recommended intersection locations overlapped with the Vision Zero Action Plan Update. The Red Light Camera list is in order of broadside crashes, which are almost always caused by red light running. However, the ordered list in the staff report does not match the ordered list on the map. I don’t know which is correct. The Top 20 intersections in the VZ Action Plan Update are numbered, but not in ranked order. There is an overlap of eight intersections. I also bold-faced the roadways that show up more than once in the list. There is a pattern here – these are the arterial roadways that the city designed to encourage unsafe speeds and unsafe driver behavior. No surprise that these are the locations of red light running crashes.
| Rank | Red Light Camera intersections | Vision Zero Top 20 intersections |
|---|---|---|
| 1 | 5th Street & I Street | no |
| 2 | Truxel Road & Arena Boulevard | yes |
| 3 | Del Paso Boulevard & Evergreen Street/Lampasas Avenue | yes |
| 4 | 65th Street & Lemon Hill Avenue | no |
| 5 | Freeport Boulevard & Florin Road | no |
| 6 | Folsom Boulevard & Howe Avenue/Power Inn Road | no |
| 7 | Truxel Road & Gateway Park Boulevard | yes |
| 8 | Stockton & Elder Creek Road/47th Avenue | no |
| 9 | Fruitridge Road & Power Inn Road | no |
| 10 | 65th Street & Fruitridge Road | no |
| 11 | Mack Road & Valley Hi Drive/La Mancha Way | yes (as La Mancha Way & Mack Rd) |
| 12 | El Camino Avenue & Northgate Boulevard | yes (as Northgate Blvd & W El Camino Ave) |
| 13 | 16th Street & J Street | yes |
| 14 | 12th Street & North 16th Street | yes (as North 12th St & Richards Blvd, and North 16th St & Richards Blvd) |
| 15 | 3rd Street & Capitol Mall | no |
| 16 | El Camino Avenue & Evergreen Street | no |
| 17 | Florin Road & Greenhaven Drive | no |
| 18 | Franklin Boulevard & Brookfield Drive | no |
| 19 | Cosumnes River Boulevard & Bruceville Road | yes (as Bruceville Rd & Cosumnes River Blvd) |
| 20 | Truxel Road & Del Paso Road/Natomas Boulevard | no |
Map of proposed Automated Red Light Camera locations, and SB 535 disadvantaged communities.
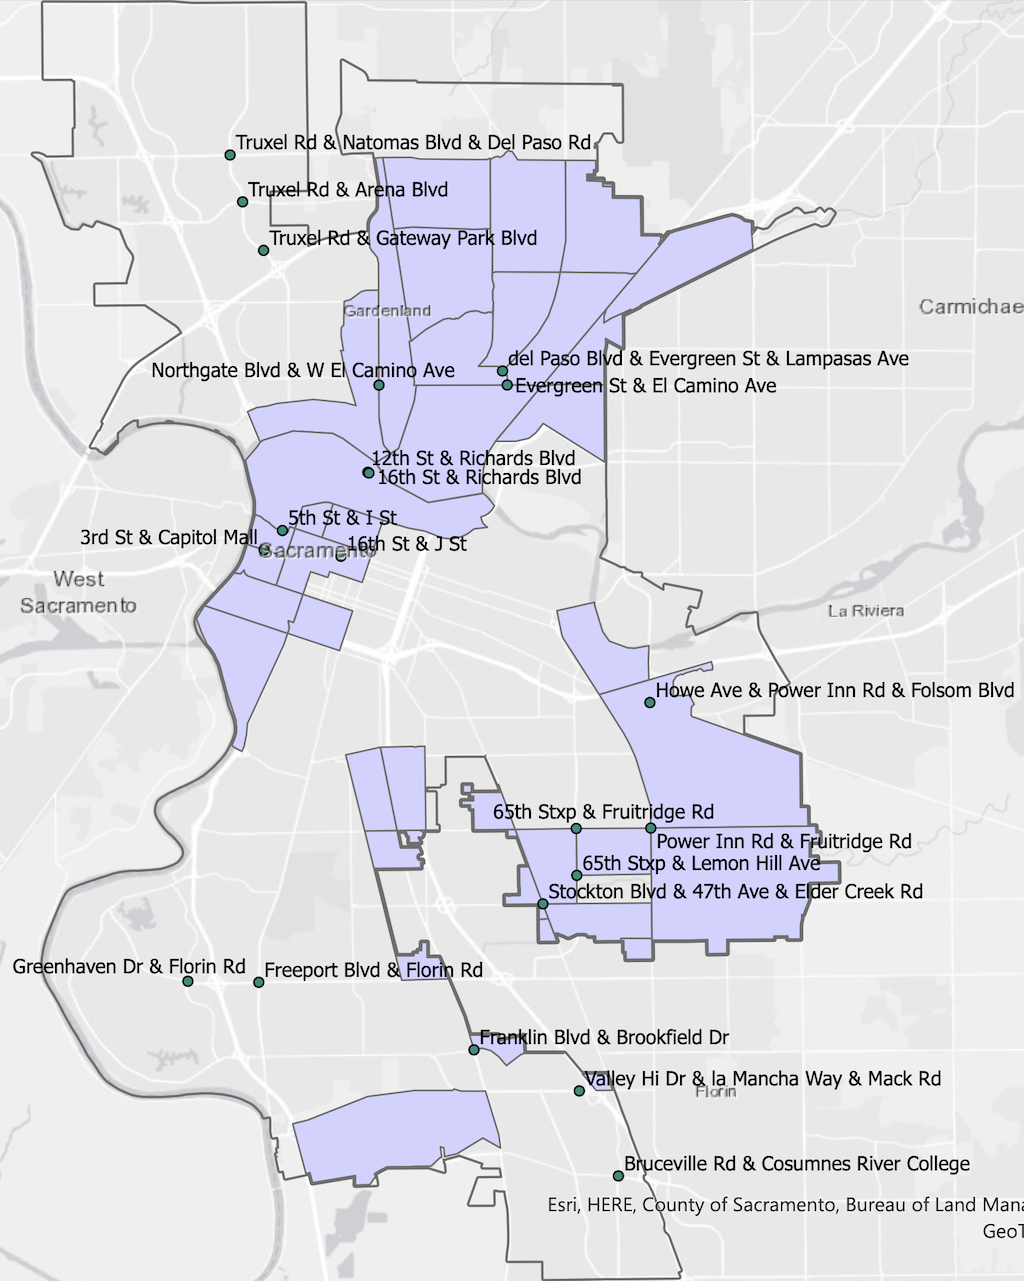
Of the 20 locations, seven are not in SB 535 areas, four at at the edge of SB 535 areas, and nine are within SB 535 areas. I would not say that the cameras are concentrated in low-income communities, however, many equity organizations have raised concerns about camera locations. My observations of red light running are that most violations are by drivers of high-value vehicles, not low-income drivers. The seven not-in-SB 535 locations are moderate to high-income communities. The three downtown Sacramento locations are not generally low-income, though the SB 535 criteria identifies them as such. SB 535 uses a variety of measures in addition to income.
For earlier posts on red light running, see Category: traffic violence, Tag: red light camera, and Tag: red light running.


[…] I may post comments on the agenda items. Added a post on Automated Red Light Camera Program. […]
LikeLike
The city has a webpage for the Automated Red Light Camera Enforcement Program at https://www.cityofsacramento.gov/public-works/mobility-and-sustainability/transportation-planning/vision-zero/automated-red-light-camera-enforcement-program. A survey is available on that page at https://www.surveymonkey.com/r/sacredlight. There was an item in the City Minute, August 19-20.
LikeLike
[…] my previous posts: SacATC 2026-08-20: red light camera program and are there Flock cameras in the City of Sacramento?, and many […]
LikeLike
Where should Sacramento install red light cameras? See draft list of intersections https://www.sacbee.com/news/local/transportation/article316952169.html SacBee, 2026-08-21, Jennah Pendleton
LikeLike