- E-bikes offer alternative transportation option (SacBee 2016-06-04)
- 50 recovered bikes remain at Sacramento police warehouse (SacBee 2016-06-04)
- Opinion: How Sacramento can get its own Expo Line (SacBee 2016-06-04)
- Sacramento-area locales eye November votes on higher sales taxes (SacBee 2016-06-04)
- New Sacramento transit chief says agency needs to change fast (SacBee 2016-06-03); Introducing the new manager of RT (Sacramento Business Journal 2016-06-02)
- Introducing the Sprawl Tax (StreetsblogUSA 2016-06-02); Sacramento-Roseville-Arden-Arcade with $1464 per person per year, is in the middle, as usual
- Clock ticking, Sacramento rushes to prepare for arena crowds downtown (SacBee 2016-05-30)
How NOT to be nice to bicyclists
At intersections, some motor vehicle drivers offer to let bicyclists go first, even though it is not the bicyclist’s turn. To the driver, this may seem like a nice gesture, but it is often not taken that way by bicyclists.
Intersections are about taking turns, and about right-of-way rules. At a signalized intersection, the signal indicates whose turn it is and makes things simple, but at intersections with stop signs (two-way or four-way), or yield signs, or no signs, the driver (of the bicycle or motor vehicle) must use the rules and their eyes and their brain. These are the rules:
- First come, first served.
- First come, first served.
- First come, first served.
- If two vehicles (bicycles or motor vehicles) arrive at the intersection at the same time, at an angle, the one to the right goes first.
- If two vehicles (bicycles or motor vehicles) arrive at the intersection at the same time, facing each other, the one going straight goes before the one turning left.
Why did I repeat the first one three times, other than being funny? It is because too many people know the other two rules, and don’t seem to know the first.
When a motor vehicle driver yields to a bicyclist when it is the motor vehicle driver’s turn to go rather than the bicyclist’s turn, they are violating this most basic rule.
Why is this a big deal? When drivers do not take their correct turn, it leads to uncertainty for everyone, and uncertainty can lead to, at the least, frustration and anger, and quite possibly crashes.
As a bicyclist, I will not go when it is not my turn. If I did do that, I’d leave myself both physically and legally vulnerable. I have absolutely no guarantee of the behavior of other drivers who may be not polite, but taking their rightful turn, or who get impatient, or who push their way in, or even just are not paying attention.
So there is a stand-off. I shake my head no, and if that doesn’t work, I wave the driver whose turn it is to go. And then I wait. And sometimes wait, and wait, and wait. Meanwhile, I’m in a vulnerable position. Drivers behind me may get impatient and angry, not understanding why I’m not going. If I’m making a turn, I’m often stuck out in the intersection in a place that I don’t want to be hanging out, rather than having already safely completed my turn. This stand-off doesn’t increase the risk for people in motor vehicles significantly, but it very much does for bicyclists.
Motor vehicle drivers may say, “but most bicyclists don’t take their turn.” Yes, this is often true. I believe there are two things are work:
- Many bicyclists ride just like they drive. They don’t take turns at intersections, pushing their way in before it is their turn. They don’t stop at stop signs, figuring if they never really stop, they have the right of way. Yep, the same thing motor vehicle drivers do. My anecdotal observation is that car-free bicyclists are much more likely to do the right thing at intersections than bicyclists who also drive motor vehicles. My data-based observation is that bicyclists and motor-vehicle drivers comply with stop signs at almost the exact same rate. Don’t believe me? Spend some time at an intersection and see how many drivers (of bicycles or motor vehicles) come to a full and complete stop, as the law requires. Not many.
- Bicyclists have been trained by “polite” motor vehicle drivers that they don’t need to take their turn, and so they don’t. Every time a motor vehicle driver yields inappropriately to a bicyclist, it reinforces this behavior.
So, if you are one of those motor vehicle drivers, I ask you to stop yielding inappropriately.
“But, what about the bicyclist who doesn’t stop – I don’t want to run them over.” Or, “what about the bicyclist who doesn’t stop, I’m angry that they won’t follow the law and think themselves above it.” The answer is to be hyper-aware at every intersection. These are the places where most crashes occur, and so they are good places to pay extra attention, and use your brain rather than your emotions.
What everyone should be doing at every intersection (assuming no traffic signal) is:
- stop at the stop bar, or the edge of the crosswalk if there is no stop bar; if you can’t see from there, then creep forward until you can see, but only after having initially stopped
- look left, right, and left again before entering the intersection
- make eye contact with any person who may do something unexpected; this means other drivers, bicyclists and pedestrians, really, anyone else who is there
- yield to pedestrians
- continue looking left and right, as well as forward, going through the intersection; you can never be certain that someone else is not violating the law and endangering you
If you do this, then the “rogue” bicyclist who is not following the law and taking turns will not be a complete surprise to you. You will be able to respond appropriately, ensure that a crash does not occur, and go on your way. Everyone ends up safer, everyone ends up happier.
By the way, a bicyclist who does not stop when there is no one there to yield to or to take turns with is, yes, violating the law, but is not failing to practice safety. Bicyclists can see better and stop faster than any motor vehicle driver. So if you see a bicyclist at a distance, slowing and looking but not stopping when there is no one there to interact with, understand that they are acting in a completely safe manner. Take off your law enforcement vigilante hat, and smile.
News summary 2016-05-29
- Soapbox: Sacramento transportation sales tax is on track (SacBee 2016-05-27)
- State employees offered bikes to rent as option for downtown trips (SacBee 2016-05-25)
- New $11 million bridge links Sacramento City College, Curtis Park (SacBee 2016-05-25)
- Midtown Sacramento housing developments up for review this week (SacBee 2016-05-24)
- Sacramento patches … then re-patches city streets (SacBee 2016-05-23)
SacRT frequency and stops
Two more maps for your viewing pleasure.
The route frequency map classifies routes by their frequency of service, as 12, 15, 20, 30, or 60 minute frequency. Mostly, this means service from 6:00AM to 7:00PM, though it is shorter in a few cases and longer in several cases. Peak only routes are not shown at all. Map below and pdf SacRT_frequency.

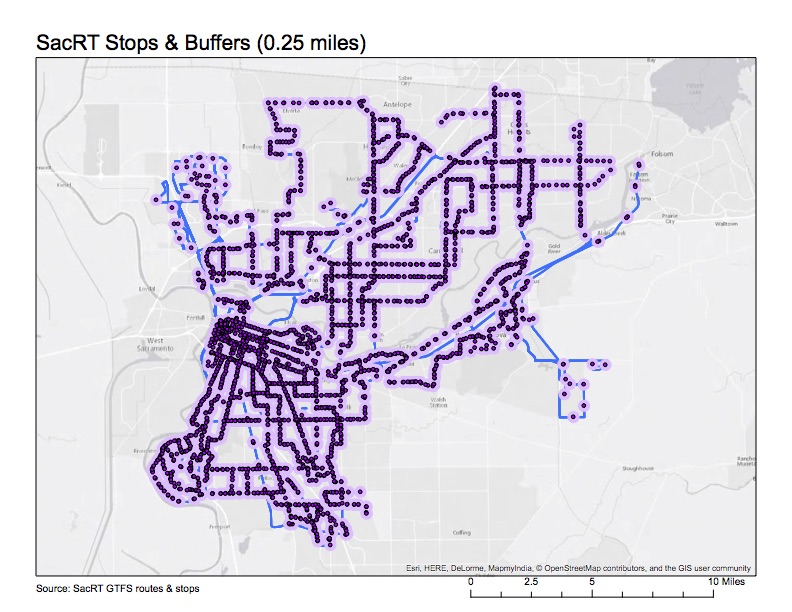
The other map is a different view of the routes, shown as stops with quarter mile buffers (one of the often-used walking distance to transit stop criteria, though of course some will walk further, some less, and bicycling distances are much greater. Though at this scale, the map is not significantly more interesting than the simple route map, when zoomed in, there are some very interesting patterns. I see places with stops placed closer than need be, and some places with stops placed too far apart. I’m playing with an alternate version that also shows the population density data, but not ready with that one. Map below, and pdf SacRT_stops. This is one of the first ones that I will try to put up on ArcGIS Online since it really benefits from zooming.
SacRT bus route productivity
Yet another map that may help with understanding the service changes (cuts) proposed by SacRT.
I attended the SacRT board meeting last evening, where there was a presentation by staff on the service changes (agenda item 13), some public comment, and some questions from the board. The gist of the comments and questions seems to be “don’t cut my route,” which is understandable, but doesn’t really advance the discussion much. Mike Barnbaum had the most interesting comments, as he had some innovative ideas for redesigning routes. I briefly presented my design ideas explicated in a previous post (SacRT service changes), and commented that, for the public, the selection of service changes is too much of a black box, input necessary savings, turn the crank, and get out service changes. General Manager Mike Wiley suggested a lot of complex analysis goes into the proposals, addressing in particular questions that were asked by the board about destinations and attractors, however, it isn’t apparent to the public what the criteria are and how they are weighted. Anyway, on with the map.
The map (pdf SacRT_productivity-R2)shows all bus routes for which ridership data is available from the SacRT Monthly Performance Reports page. I selected the last available report, fourth quarter 2015, for weekdays. The variable mapped is “passengers per service hour” which is one of the metrics used to measure productivity, and therefore make decisions about routes, but it is certainly not the only metric. The SacRT minimum goal is 27 passengers, so that is one of the break points, with red and orange routes below that level. Only bus routes are mapped, not light rail, because I am not sure if light rail numbers are directly comparable to bus routes. They are certainly much higher, at least for Blue and Gold, as the trains have a much higher capacity than buses.

I realize that all these maps I’m creating would be more useful if presented all together, in an interface that allows the user to turn them on and off, looking at different combinations. That is a part of ArcGIS that I don’t know yet, so there is perhaps my next learning opportunity.
SacRT with density and income
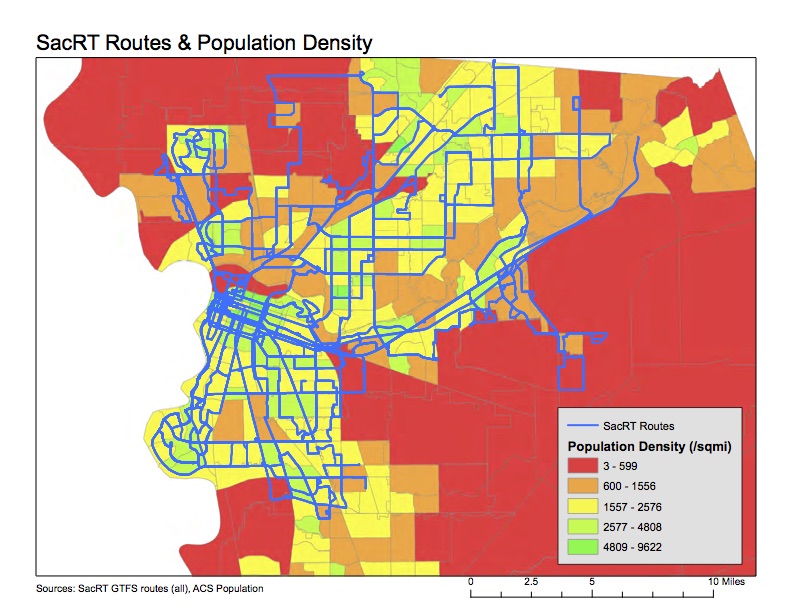
Investigating the proposed SacRT service changes (cuts), I identified that routes serving low density areas are a problem. I developed the map below (pdf SacRT_pop-density) showing routes and population density, with low density areas shown in red. Two routes stand out as servicing primarily low density areas, which are unlikely to ever be productive in a ridership sense. In fact, one of the reasons SacRT struggles to provide efficient transit service is the low-density nature of the county. Though of course agricultural areas north and south of the urbanized area will be low density, there are also large areas of low-density suburb and exurb (sprawl) which will never be successful. Every greenfield development allowed by the county and cities just exacerbates this problem
The population data is from the American Community Survey (ACS) 2014 5-year estimate (S1903), selected by census tract and matched to census tract outlines provided by SACOG, showing residents per square mile. The routes are from the Google Transit Feed Specification (GTFS) provided by SacRT. All routes are shown, including commute hours, low frequency, moderate frequency, and high frequency routes, as well as routes operated by SacRT under contract with others. It would be more useful to identify and/or separate out different kinds of routes, but it takes a while to compile that data, and I’m not quite there yet.
News summary 2016-05-22
- Light rail Green Line may shut in Sacramento to save money (SacBee 2016-05-21)
- Despite safety benefits, there’s no consensus on bike helmets (SacBee 2016-05-19)
- Sacramento launches plans for bike trail through south city neighborhoods (SacBee 2016-05-17)
- Help the City of Sacramento enhance its transportation network for cyclists and pedestrians (City of Sacramento Express 2016-05-17)
- Back-Seat Driver: Lots of transportation tax measures are headed to November ballot (SacBee 2016-05-16)
- Homebuilders spend big to fight El Dorado County slow-growth measures (SacBee 2016-05-16)
SacRT service changes
Sacramento Regional Transit (SacRT) has proposed service changes, primarily elimination of routes, most of which would go into effect January 2017, with a few before that and more after than. The proposal is available (summary chart after the jump), and a more detailed analysis is in the Board of Directors agenda (Item 13) for the May 23 meeting. At the May 23 board meeting, the service changes will be an informational item, not a decision. Five open houses on the service changes were scheduled, two of which have occurred, with three yet to go. I attended the open house at SacRT headquarters on May 17.
I was asked for my thoughts on the service changes. Below is a bullet summary, followed by the nerdy details.
- SacRT should make the boardings dot map available to the public. It is the best information I’ve seen to indicate which routes are productive, and which not, more understandable to the public than the tables of numbers in the proposal. Additionally, all maps showing routes, including of course the system map, should have an indication of the service frequency, either by color or weight. The “all routes looking the same” maps that SacRT currently uses do not communicate this critical piece of information.
- A portion of savings from elimination or combination of routes should be reinvested in other routes which could be moved from acceptable productivity to higher productivity with frequency, service hours, or routing improvements.
- Reductions in frequency are counter-productive, usually making a route with challenges into a failing route, which will then be identified in a future round of service changes for elimination.
- Routes serving low density residential and semi-rural areas should be cut before routes serving moderate to high density residential areas.
- Combining routes for more efficient coverage, particularly where routes overlap or are very closely parallel, is a good idea.
- Saturday service should be retained on all routes. Transit-dependent riders who work the usual weekday work week must have service on at last one weekend day so that they can grocery shop, visit friends and family with less mobility, and seek medical care.
- Routes should not be eliminated for at least two years after creation or significant revision. Time is needed to see ridership trends once people in a community adjust to the service. Specifically, this means: do not eliminate Route 65 Franklin South.
- The concept that routes should focus on light rail connections rather than radial routes to downtown, or point-to-point routes, should be considered in all route decisions.
- SacRT should do a complete system re-visioning within the next four years. A series of cuts, and even transit renewal, has left a system that is inefficient and probably unjust. It should be redesigned from scratch.
A conference done right
I attended the Transportation Equity Summit in Sacramento today. Unfortunately work obligations will prevent me from attending the advocacy day tomorrow. I’d like to comment on the conference.
Though short, the conference was GREAT. In the lunch-time plenary session, three good speakers laid out some basics, but plenty of time was reserved for questions from the moderator and the audience. This was followed by a half hour networking session (with coffee and cookies), then three breakout sessions, then another networking break with tea and cookies, and two final breakout sessions. In the two breakouts I attended, at least one-third of the time was devoted to questions from the participants. In the evening there was a social function at the hostel, with a brief but very interesting presentation, three short awards, and much more networking over beer and wine.
This is the way a conference should be done. Too many conferences in Sacramento over the last few years, on transportation and livability topics, seemed to intentionally exclude participation. The speakers filled up all the available time, there was no planned time for networking, and the overall feeling was that the experts were telling the rest of us what we needed to know (the sage on the stage), though ironically there was far greater expertise in the audience than on the stage. It is my hope that we never need suffer another one of those authoritarian conferences in Sacramento, and that the Transportation Equity Summit sets a bar that all others must now reach. If you have the opportunity to participate in future transportation related conferences in Sacramento (or anywhere), I hope that you will ask very tough questions about the program format before you sign up, and if the conference is clearly not going as advertised, stand up and object strenuously, and in fact make sure the conference doesn’t proceed until it is fixed. Obviously I have strong feelings about this. I’ve been burned by the lies of conference organizers, and will not ever trust many of them again.
Thank you to Transform and California Bicycle Coalition, their leaders, and Katie for a great conference, done professionally, and inclusively, and with humanity.
News summary 2016-05-15
- New report shows transportation funding problems in Sacramento (KCRA 2016-05-12); pretty air-headed article
- Sacramento student’s pitch pays off with bike lanes on Freeport Boulevard (SacBee 2016-05-11)
- Daniel Weintraub: ‘Bicycle friendly’ an afterthought in Sacramento (SacBee 2016-05-10)

