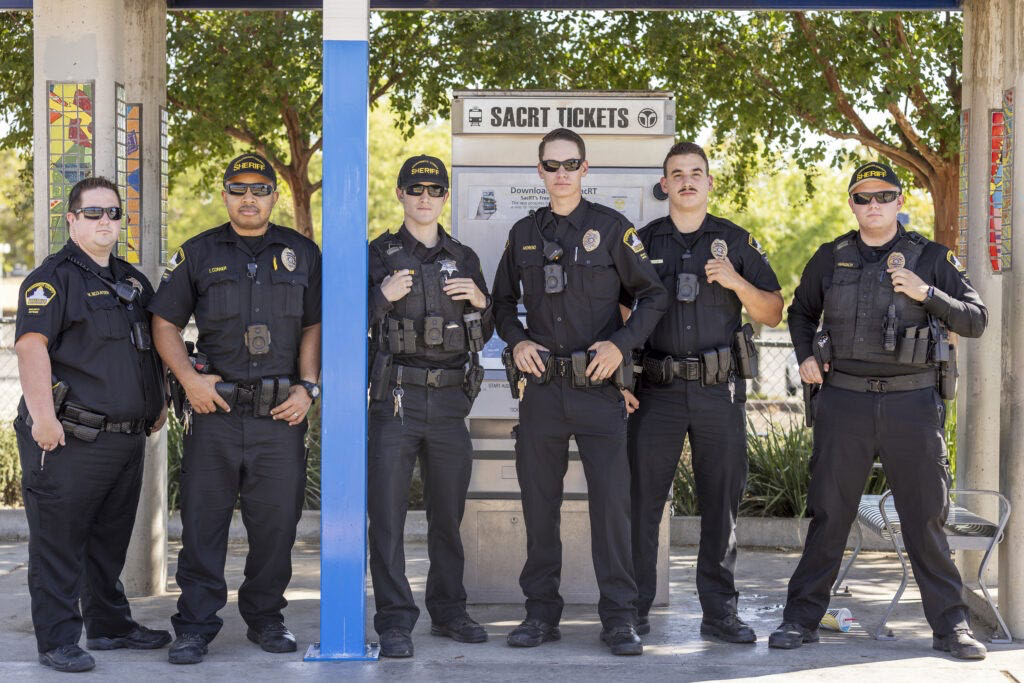
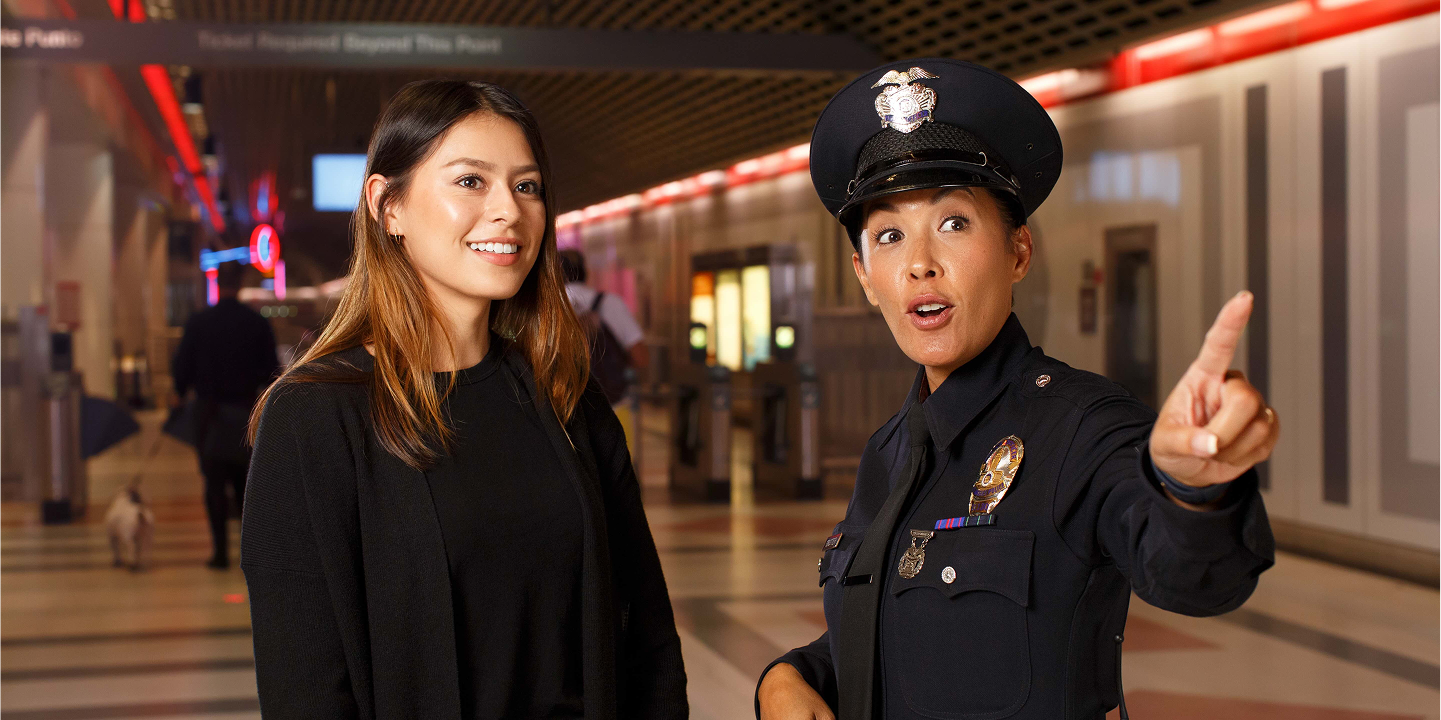
SacRT photo of Sheriffs Department officersMetro photo of LAPD officer and rider
SacRT staff Lisa Hinz presented a justification for zero tolerance fare enforcement on light rail at the 2026-07-27 board meeting. She used Metro (LA country transit agency) as an example, but mis-used it in a way that contradicts her point. So, fair game, this is real information from Metro. Hinz used the photo on the left in her presentation. The photo on the right is from the Metro Safety Team page, Law Enforcement Partners. A picture is worth a thousand words. Enough said.
If you wish to look at Metro’s approach to safety, including their nine related positions, see Metro Safety Team webpage. The position descriptions are available.
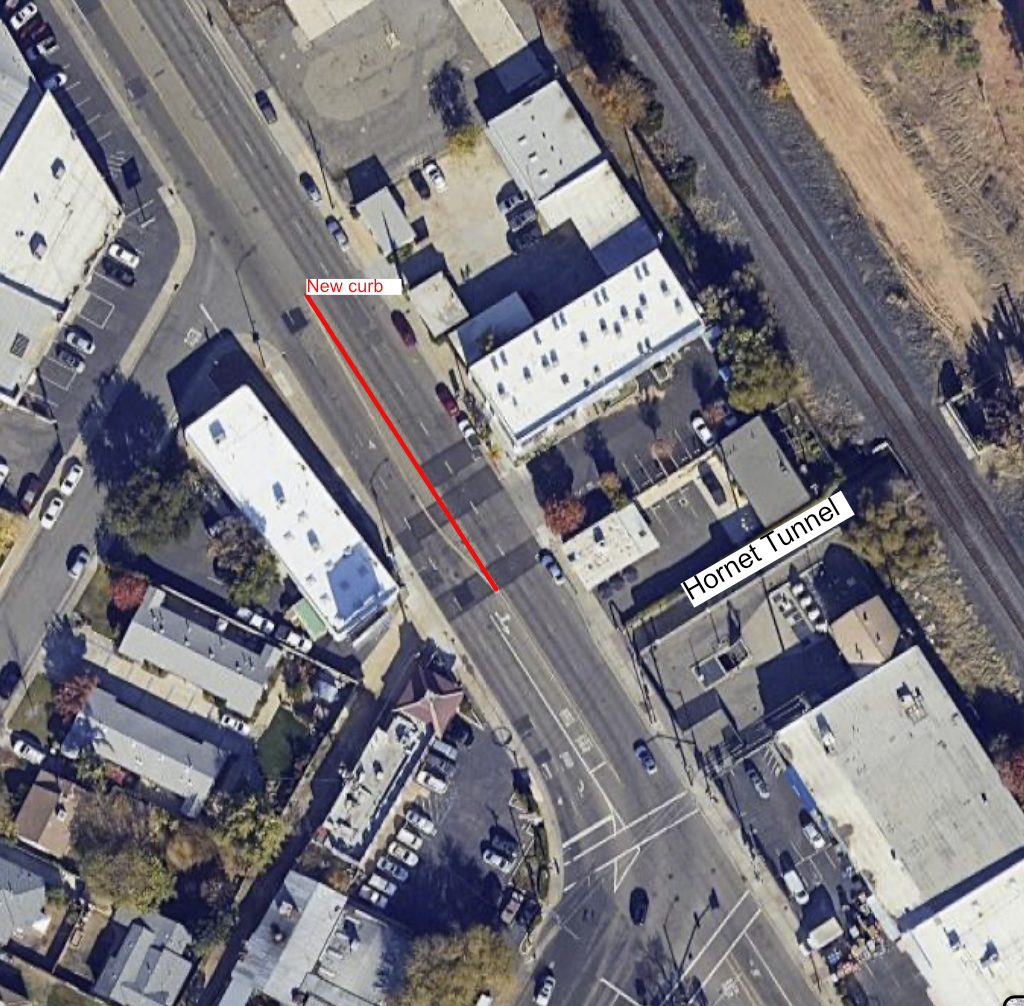
“Recently the city has installed a new 6-inch curb in the center of Elvas Ave. right alongside The Line, probably to prevent Doordash drivers from making left turns in or out of there. Now if you are coming from 62nd St., you can’t turn left to get to the Hornet Tunnel. They didn’t put in curb cuts for bicyclists. The old curb had some openings. Your options are to ride to 65th St. and make a U-turn, salmon up Elvas on the wrong side of the street, ride on that horrendous excuse for a sidewalk on the east side of the street, or stop in the middle of the street and carry your bike over the curb. The section of Elvas Ave. between 62nd St. and the Hornet Tunnel should have protected bike lanes, similar to what was built on Rod Beaudry Dr. several years ago.”
So I went to take a look. This seemingly minor project has indeed made things worse for bicyclists. A bicyclist eastbound on Elvas Avenue used to be able to use the center turn lane to come close to the Hornet Tunnel entrance before having to cross to the east side of Elvas. Not ideal, but acceptable for ‘strong and confident’ bicyclists. Now, that transition must occur way back at 64th Street.
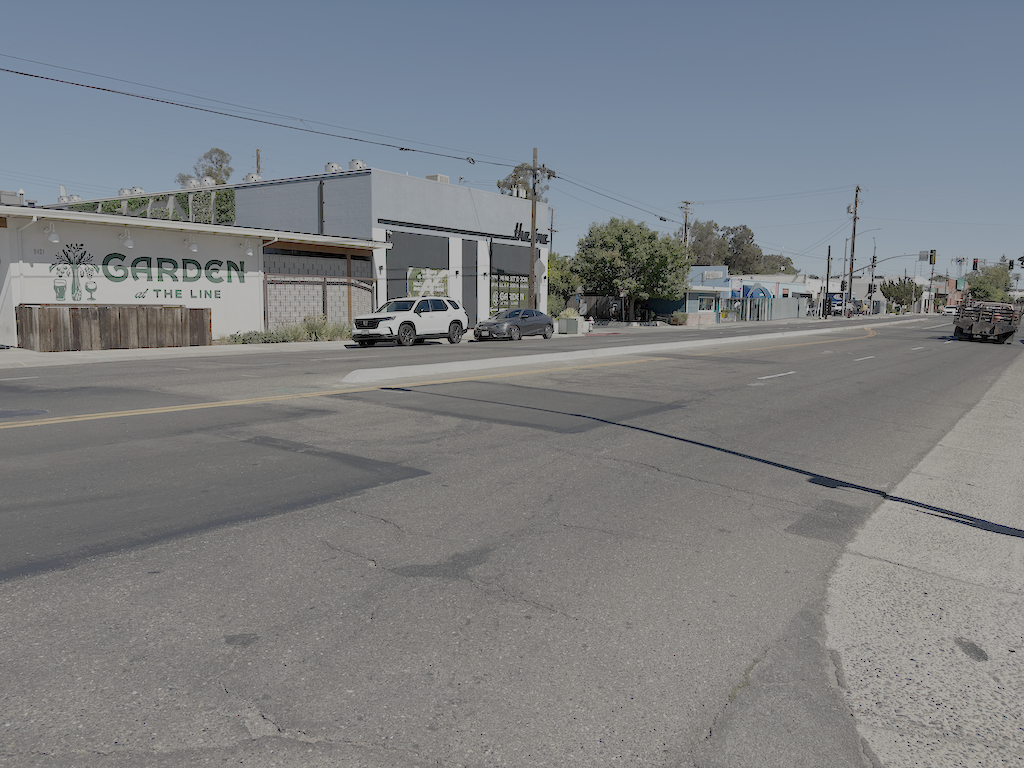
map overview of Elvas Ave between 64th St and 65th Stnew curb on Elvas Ave at The Line
I have written several times about the hazard that Elvas Ave presents to bicyclists (as well as everyone else) and requested that the city come up with a plan to fix it. A large number of other advocates have requested the same. The city has done absolutely nothing. (Elvas Ave and Hornet Tunnel, Elvas Ave and Hornet Tunnel update, M Street to Hornet Tunnel. The route which includes L Street, M Street, and 63rd Street is one of the most used bicycle routes in the city, particularly when Sac State is in session, but throughout the year. It is quite pleasant and safe, except for this short stretch along Elvas Avenue which is incredibly dangerous and uncomfortable. Stress level 4 plus.
As pointed out by the commenter, this concrete curb was probably placed to eliminate left turns into and left turns out of the driveway at The Line. (By the way, this is a 7 inch curb. The city no longer uses 6 inch curbs because drivers with large trucks just drive over them.) So for motor vehicle drivers, it is at least somewhat safer. I’m not sure how long it has been in place, but there are black tire marks on both sides of the curb, indicating that drivers are running into the curb. The city could have placed a short cut in the curb to allow bicyclists to turn left onto the sidewalk and into the tunnel. But they did not.
Probably even more egregious is that the city permitted The Line and Garden at The Line developments without any requirement for, or even plan for, calming traffic at this location. Why was the development approved without a solution. The problem was known, and it was known that traffic would get worse with this development.
When I was there today, I crossed Elvas Avenue so as to get photos from both sides. Crossing back to the west at the north end of the curb, three drivers failed to yield to me, though there is a crosswalk (unmarked) there. The fourth driver, turning out of 64th Street to Elvas, accelerated belligerently towards me and I had to run to keep from getting hit. This was broad daylight with a not particularly high volume of traffic. In the evenings when hundreds of people are trying to cross Elvas to and from Garden at The Line, it is much worse. People will die here. And those deaths will be on the city staff that has failed to fix this traffic hazard.
The City of Sacramento established a Tactical Action Group (TAG) otherwise known as Transportation Safety Team, in March 2025. Unfortunately, very slow progress has been made on this. The program lead is in place, Philip Vulliet, and an administrative assistant, but the other five positions have not. The city has a difficult time filling positions, particularly engineering position, as the pay level is low compared to other entities and private industry. A webpage for the program has not been established.
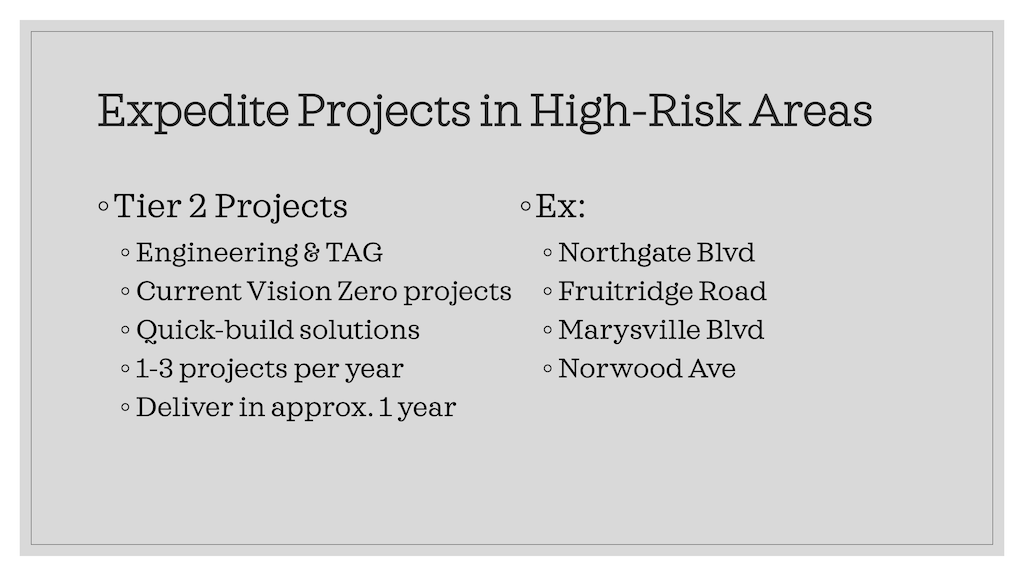
So far as I know, the only information on the program is a presentation given by Mr. Vulliet to Strong SacTown in June 2026. I think there was a presentation to SacATC, but I’ve been unable to find it. The slides are below, but they are not very specific. The Strong SacTown meeting notes have more detail, and follow the slides. Thank you, Strong SacTown.
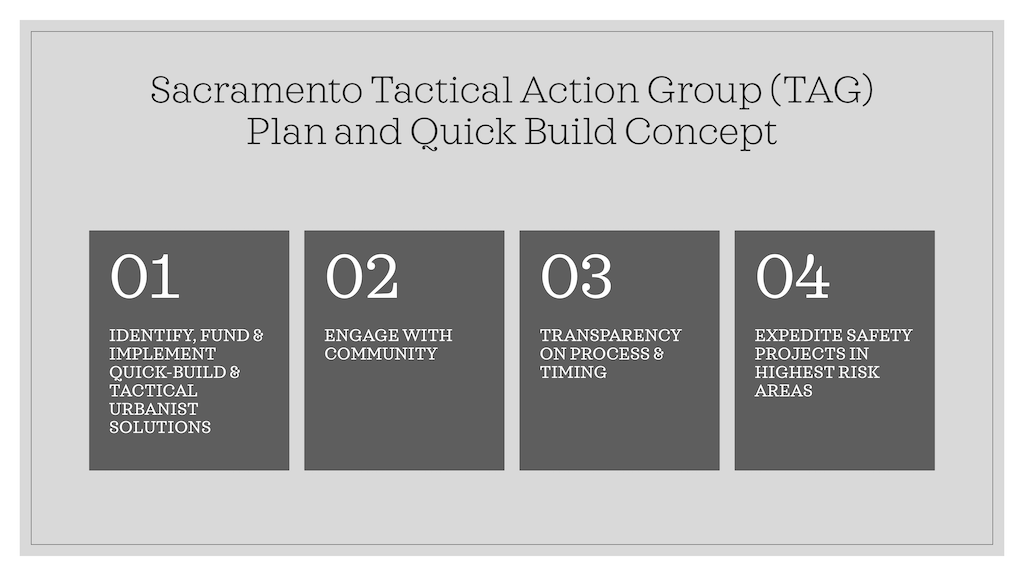
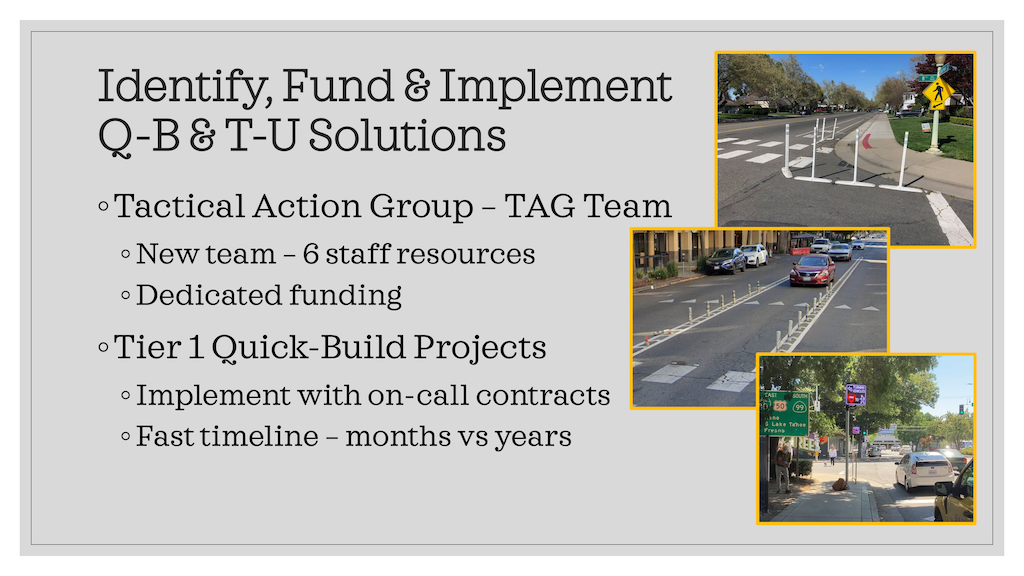
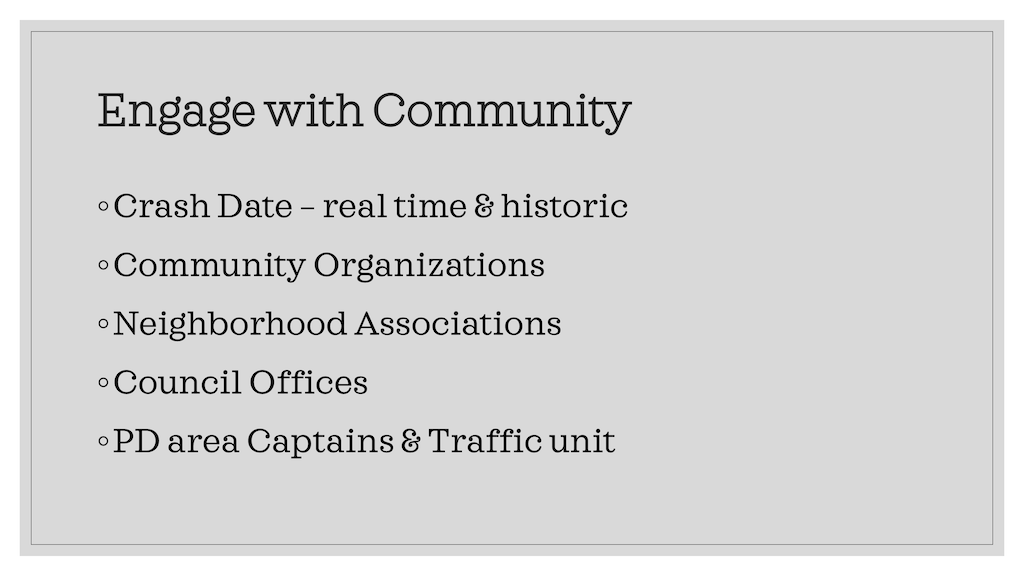
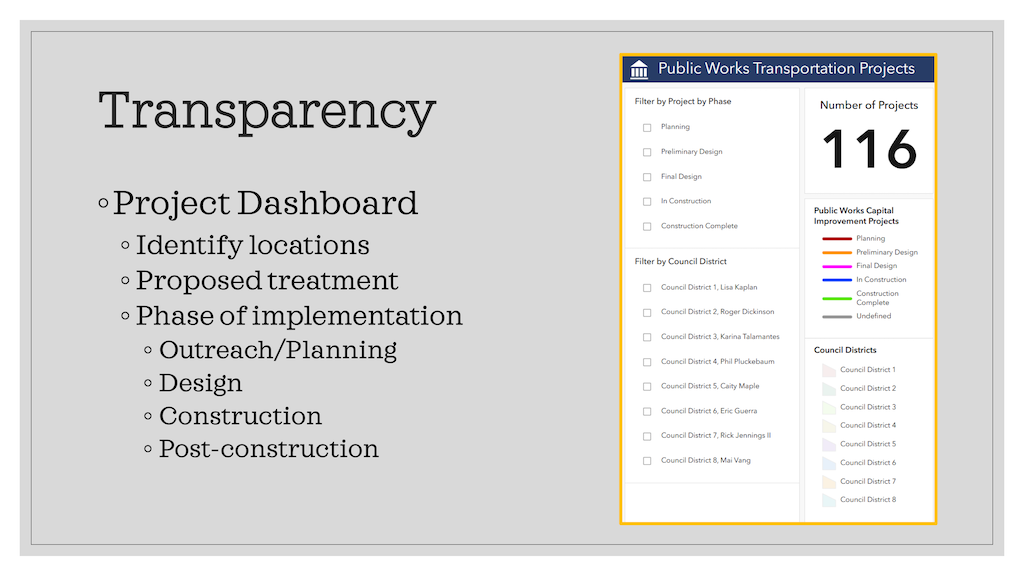
gallery of slides from presentation on Tactical Action Group, at Strong SacTown 2026-06-04
Phil Vulliet (VOO-lee-ay) is the new lead for the city’s Safety Response Team where he will help Sacramento respond faster to urgent safety needs and continue advancing the City’s goal of eliminating fatal and severe injury crashes.
About Phil: 20+ years of experience. Project manager for capital improvement projects (aka big road projects) for last 11 years. Managed Broadway Complete Streets, Downtown Mobility Project, and others. Prior to that, did consulting.
2018 City passed Vision Zero Action Plan. Based on 10 years previous accident data. Established list of high-injury network – responsible for >70% of serious injuries in cities. Looked at root causes of vehicular violence and impact on pedestrians and cyclists. Looked at impact on bicycles and pedestrians – 40% fatal collisions. We need to protect them.
Planning efforts came from the research – top 5 corridor study, 6-10 corridor study is now in planning and quick builds will be prioritized as well.
Parking protected bike lanes were created and then the central city mobility project was completed in 2024 as well as broadway complete streets, Franklin complete streets wrapping up and northward school access was completed.
Funds are being used to match grants.
13,000 crashes still (all mode crashes)
Transportation safety initiative was passed in 2025 – responsibility to track now.
Transportation Safety Team (TST) – established jobs for 6 FTE’s
Quick builds – rapid implementation limitations (no land acquisitions), limited electrical work, excavation only by city crews (try not to dig), Council action needed – assigned project in tiers
Tier 1 – quickest of quick builds – surface treatments (Paint and Plastic), includes alterations in traffic circulation. Community informed
Tier 2 – outside of the TST team – require full plans and bidding. Pilot projects. It takes about a year.
Quickbuilds are faster than CIP
CIP – Safety program, quick build CIP – sales tax generates the funds for the safety programs
TST – They require contracting readiness, design delivery capacity, need new processes and new tech as well as outreach, follow-up and reporting needed.
They were given an exception by the city council that they are allowed to go to contract vs. go to bid
Software platforms can share real-time speeds and volumes without having to do a traffic study (speeds up the process of evaluation)
Outreach is beyond critical – it’s about equity, some cities are more organized than others. TST only has so much staffing to support and cannot watch every intersection.
Feedback needed when the quick build has been built and if it’s not working, that’s the beauty of it, they can fix it quickly.
The public facing GIS dashboard is up and is working to create a map to show where in the city there have been quick builds implemented.
Q&A Notes
Q: Gets through
A: Budget will help, it will increase funding, but that is not the limiting factor
Q: Process to determine an LPI (Leading Pedestrian Interval)
A: Megan Carter – give pedestrians a few extra seconds of time to provide more time. LPIs will be implemented everywhere, unless we can justify not doing it. There are some lawsuits if you don’t implement LPS ( not being equitable if it does not include LPS). ATC will go with a plan next year.
Q: What are issues you face when you change the fabric of the street
A: Daylighting and recommended clearance and it was 25% parking loss. New state law that doesn’t require any parking to be provided. Willing to accept delays for cars.
Q: Streets are designed like roads and are in urban areas. When you add parking it does slow people down.
A: They do try to account for that. Ideally if he had a magic wand he would make the traffic slower.
Q: is that a tier 1 or a tier 2
A: We can look at curb usage and how we monetize it and manage uber’s, lyft’s and waymo.
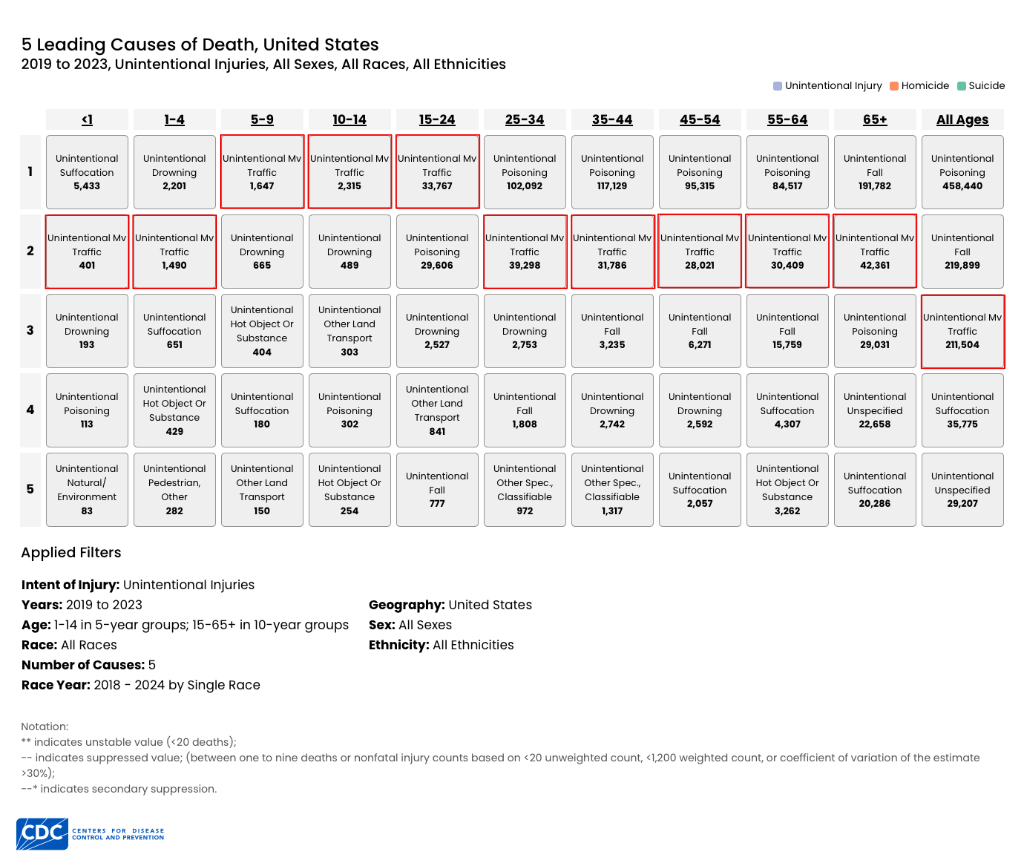
The chart below shows the leading causes of ‘unintentional’ death in the US, 2019 to 2023. The chart is from Centers for Disease Control (CDC) WISQARS Leading Causes of Death page. Change filters to see the ‘unintentional’ data. Ironically, one of the available filters is ‘Violence-Related Injuries’, but these ‘Unintentional MV (motor vehicle) Traffic’ datum are not in that category, though they are clearly violence. Traffic violence. And of course not all is ‘unintentional’. And as with all traffic violence data, it does not include crashes that occur on private property, people run over in parking lots and children killed in their own driveway.
I often see it stated that traffic violence is the leading or second leading category of preventable death, but I find this more detailed view worthwhile.
Credit to Emergency Streets for the idea, and the link to CDC WISQARS. My selection criteria is slightly different than theirs. I’ll write soon about Emergency Streets.
I spoke briefly on the Arden Way-Auburn Blvd Mobility Plan (item 3), mostly just to say this is a walker and bicyclist hostile area, and it will take significant changes to make it useable and welcoming to people. Arden Way adjacent to the Arden Fair Mall is extremely wide, and crossing there is uncomfortable even with signals and walk signs. Of course the worst intersection of all is Arden Way, Alta Arden Expressway, Exposition Blvd, and Ethan Way, a complex and dangerous intersection for all modes, where it is not even obvious where one could go, let alone what might be safe (spoiler: there are no safe ways here). This intersection is partly in the city, and partly in the county, which may be why it was not included here. Commissioners commented that RRFBs (Rapid Rectangular Flashing Beacons) should be removed from this plan and from the city’s toolbox, as drivers do not yield to walkers at these location in this city. There were also comments about the lack for a direct path and wayfinding for moving from the levee trail to the soon to be opened bicycle path on the Business 80 bridge, and through CalExpo to the Arden Fair area.
My longer comments were about the Vision Zero Action Plan Update draft (item 5). The draft plan has just been released, and I will be looking at it in more detail. I’m also part of the task force. The draft plan does not at this time include the appendices, so my comments were based on the SacATC documents and a quick read of the plan.
Positive:
overall, an improvement over the 2018 plan
added focus on Top 20 intersections, as that is where most crashes occur and are prominent in areas of persistent poverty; this was a major weakness of 2018 plan
prioritization of vulnerable users and sensitive areas is good
recognition that arterials are almost entirely the problem, which is due to outmoded and unsafe design; though a lot of complaints are made about speed and driver behavior on local streets, that is mostly not where the fatalities and severe injuries are happening
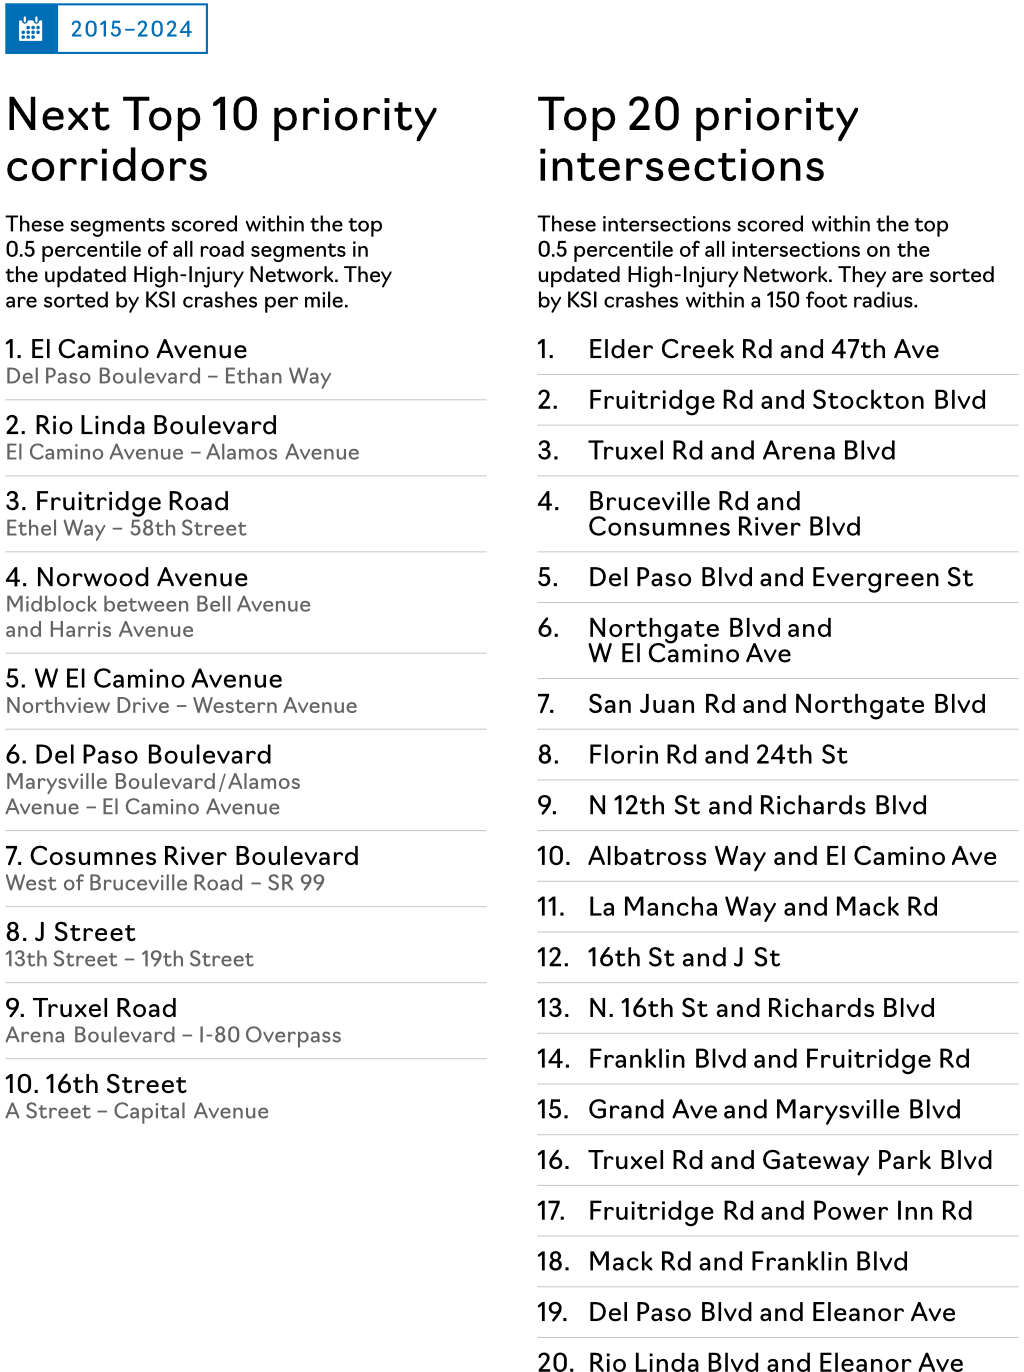
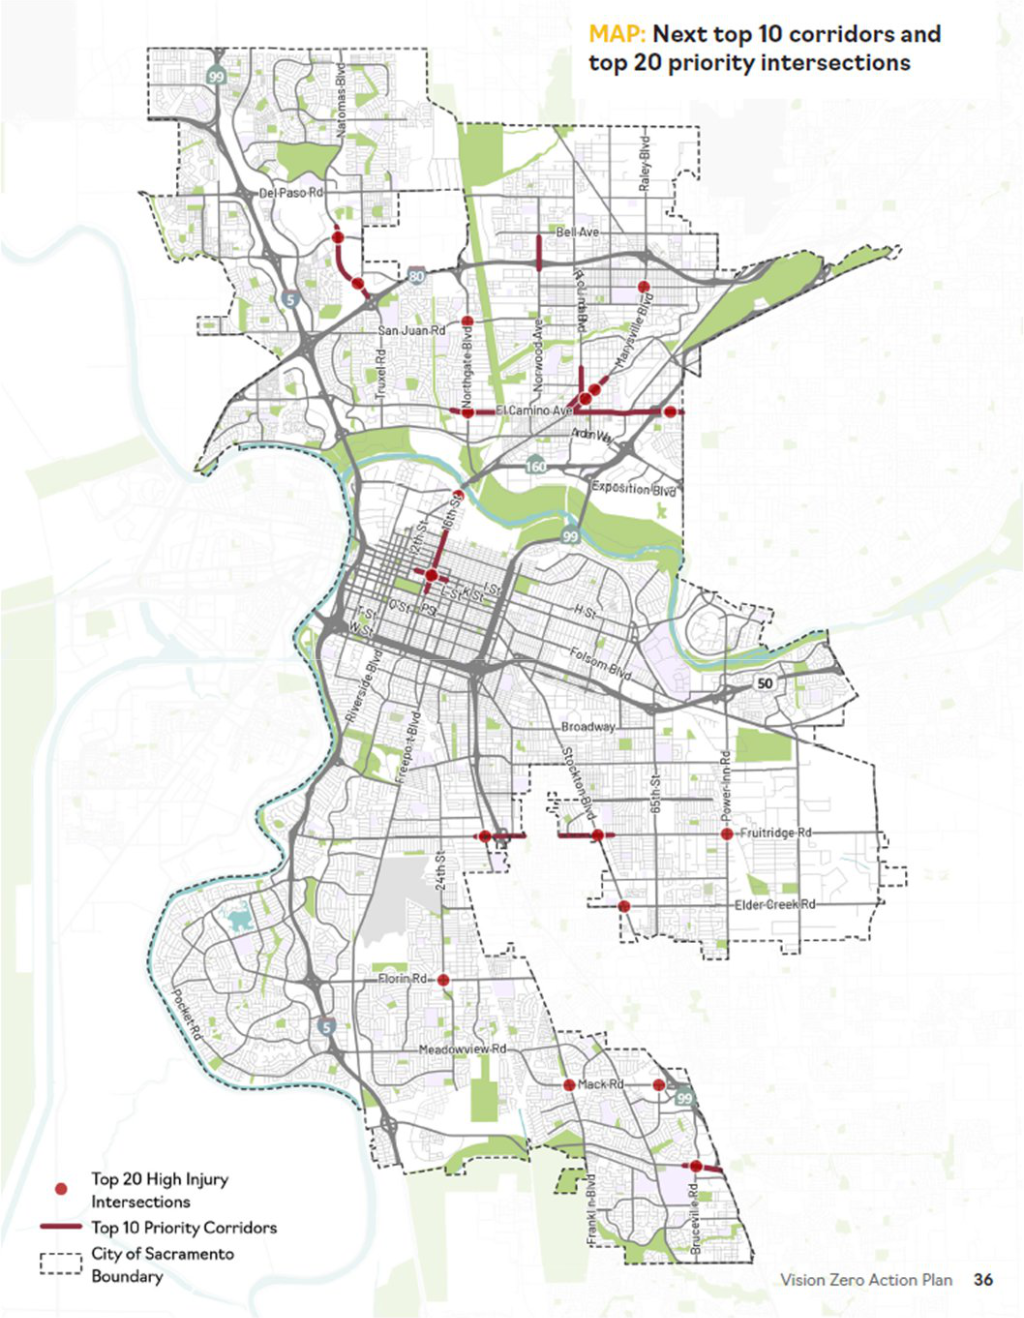
I particularly like high priority action H7, addressing 10 priority intersections
Would like to see:
case studies on completed corridor projects showing change since completion
identification of which Top 20 intersections are good candidates for quick-build under Transportation Safety Team; some intersections are so bad that nothing but major reconstruction will make them safer
Top 20 intersections should be explicitly added to the Transportation Priorities Plan, not just corridors
Negative:
this is really just a plan, not an action plan; an action plan would detail what actions will be taken, when, and with what funding
rejection of using the city’s general fund (p.66) to mitigate safety issues is a mistake; city staff including the City Manager should promote use of general funds, and the council should provide the political leadership to allocate significant funds to the program; failure to use general funds will stretch efforts out by decades
because traffic signals are so expensive ($1M plus), new and major modifications should be de-prioritized in favor of other actions, though timing modifications are appropriate; new signals are not an affordable safety solution
There will be several more chances to comment on the plan, June 22, July 1, and July 30 for in-person, and June 25 and June 29 for online. You can also comment directly on the plan document with the Konveio tool. See the city plan update webpage for more detail and to register for these workshops.
Slow Down Sacramento has offered a ten points for comment on the Vision Zero plan, listed below. These are well worth considering in your own comments.
Annual reduction targets for deaths and serious injuries, not just a general goal that crashes should go down.
A public implementation dashboard showing each action, responsible department, funding status, timeline, and progress.
A stronger funding strategy that treats traffic violence as a public safety crisis.
Quick-build safety reviews after every fatal and serious injury crash on the High-Injury Network.
A higher priority for project evaluation, so the City measures whether completed safety projects are actually reducing crashes.
A higher priority for the Speed and Conflict Management Plan, because speed is one of the most important factors in whether a crash becomes fatal.
Default use of proven safety tools like daylighting, leading pedestrian intervals, no right turn on red, protected left turns, and safer signal timing where conditions warrant them.
A stronger Safe Routes to School commitment, especially near schools, parks, transit stops, and high-speed streets.
Clear prioritization for Disadvantaged Communities and Areas of Persistent Poverty, where the burden of traffic violence is greatest.
Ongoing meetings of the Vision Zero Task Force after adoption, so community voices remain part of implementation and accountability.
Sac Vision Zero Action Plan Update draft – table of Top 10 corridors and Top 20 intersectionsSac Vision Zero Action Plan Update draft – map of Top 10 corridors and Top 20 intersections
I’m in Massachusetts for a folk festival. The town I’m in, Marlboro, has granite curbs (kerbs) almost everywhere. I had first seen these many years ago in New Hampshire, but apparently they are quite common in New England. Most historic districts require them, and they are used in many other areas as preferred by the town or city.
There are distinct advantages of granite curbs over the traditional western model of curb and gutter:
granite curbs last practically forever
granite curbs can be moved inward to narrow streets or widen sidewalks
gutters are not required
If a western street is changed, the transportation agency will almost always neglect the sidewalks in part because they don’t want to move curbs. Digging up and discarding curb and gutter is expensive and wasteful. Granite blocks are about 16 inches deep, but depth and width may vary. With granite curbs, simply dig a new trench and move the curb blocks to the new trench. If the curb needs to be reset, it can be done in short sections rather than tearing up long stretches of concrete.
Granite for curbs is more expensive on initial installation than concrete, roughly 1.5 times. However, concrete curbs may last as little as 30 years, while granite curbs are as much as 200 years old. Life cycle cost analysis indicates that granite is far less expensive in the long run than concrete, because the concrete must be removed, disposed of, and replaced. Looked at over a long period of time, granite is by far the most cost effective. It may be that granite would be more expensive in California. New Hampshire, after all, is ‘The Granite State’.
So called ‘modern’ curb and gutter is claimed to direct water flow away from the roadway to reduce roadway damage, but after looking at dozens of website about this design, not a single one actually explained why gutters were better than roadway profile where the drainage is to the granite curb. I suspect it is one of those street design engineering mythologies that has propagated without any research or proof.
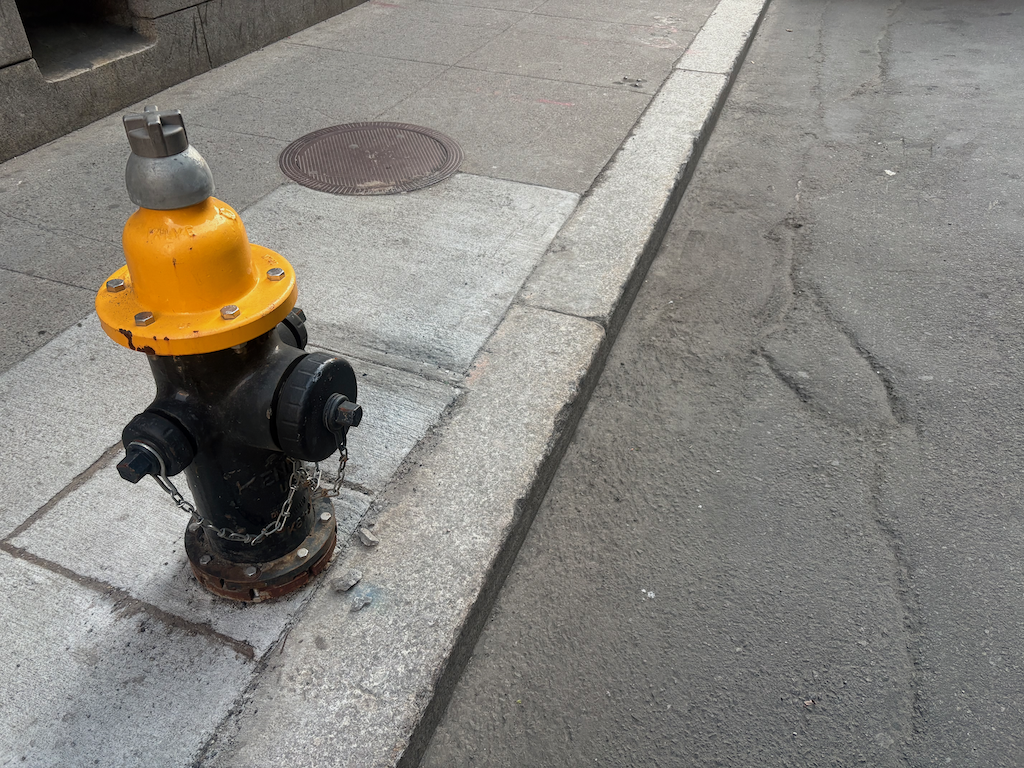
Note that in the photo below, concrete sidewalk has been replaced or patched several times, but the granite curb is original.
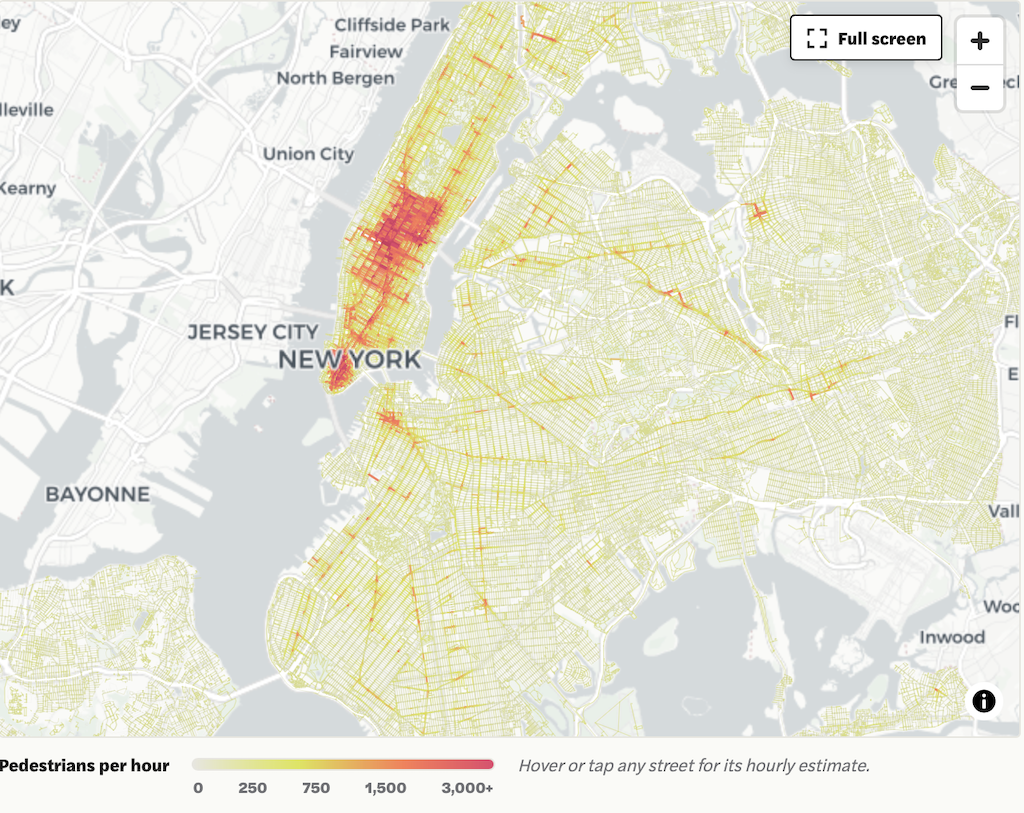
A recent article on the Vital City NYC website documents a program in New York City to not only document sidewalks, but how they are used by people walking. It was a cooperative project between MIT and the city. It is amazing what can happen when a city really pays attention to the needs of citizens who walk. Sacramento is not that city.
Of course Sacramento is nothing like Manhattan. A favorite saying of people who dislike change is that Sacramento is not New York. Or San Francisco. Or Portland. Or Paris. Or Amsterdam. Or any other city on the planet that has made progress on recognizing that people walking are the core of the city and city life. It is most certainly not any of those places people visit for its walkability. But parts of Sacramento are not dissimilar to the other boroughs of NYC, so I think this program is very indicative of what Sacramento could do, if it wanted to. If you look at the map in the article, scroll the map to the right, you will see the medium to low density boroughs.
I do travel to many places where the sidewalks are much worse than Sacramento. Looking at you, City of Los Angeles. Sacramento has decent sidewalks, where they exist, but there are sections of the city where they do not exist. And sidewalk buffers are lacking in most of the city, the topic of a future post.
The program started by documenting where the sidewalks and crosswalks are. Sacramento does not have information about where the sidewalks are and are not, where the painted crosswalks are and are not. I have done PRAs (Public Records request) for sidewalk data, and the city states that it does not exist. The fact is, some exists, but it is of low quality, and the city has apparently decided that it is better to deny existence. The Streets for People Active Transportation Plan did collect sidewalk data, but since the data has not been released to the public, it is unknown how comprehensive it is.
A good sidewalk inventory would include: presence or absence of sidewalks, width of sidewalk, presence or absence of sidewalk buffers (which the city calls planting strips) and the width of buffer, condition (deterioration, cracking, root heaves), and driveway crossings, whether flat or sloped. A crosswalk inventory would include the presence or absence of ADA ramps or ramps of any sort even if they are not PROWAG compliant, the crosswalk design (including width and length), and visibility of the crosswalk (visible or faded or non-existent).
The program then modeled sidewalk and crosswalk throughout the city, using existing studies of smaller typical areas and field counts. This is the most innovative part. That data can be used to estimate exposure, the number of people injured or killed, divided by the number of people walking. It is the measurement of rate, which is the best measure of anything related to transportation and in particular, traffic violence.
Where New Yorkers Walk, and When (MIT City Form Lab)
“Walking, after all, is not a niche activity. It is the connective tissue of urban life. It links transit to destinations, homes to neighborhoods, individuals to one another. It is also the most equitable mode of transportation we have. To take it seriously — to measure it with the same rigor we have long applied to driving — is to begin to see cities more clearly. And perhaps, in doing so, to design them more wisely.” – Andres Sevtsuk
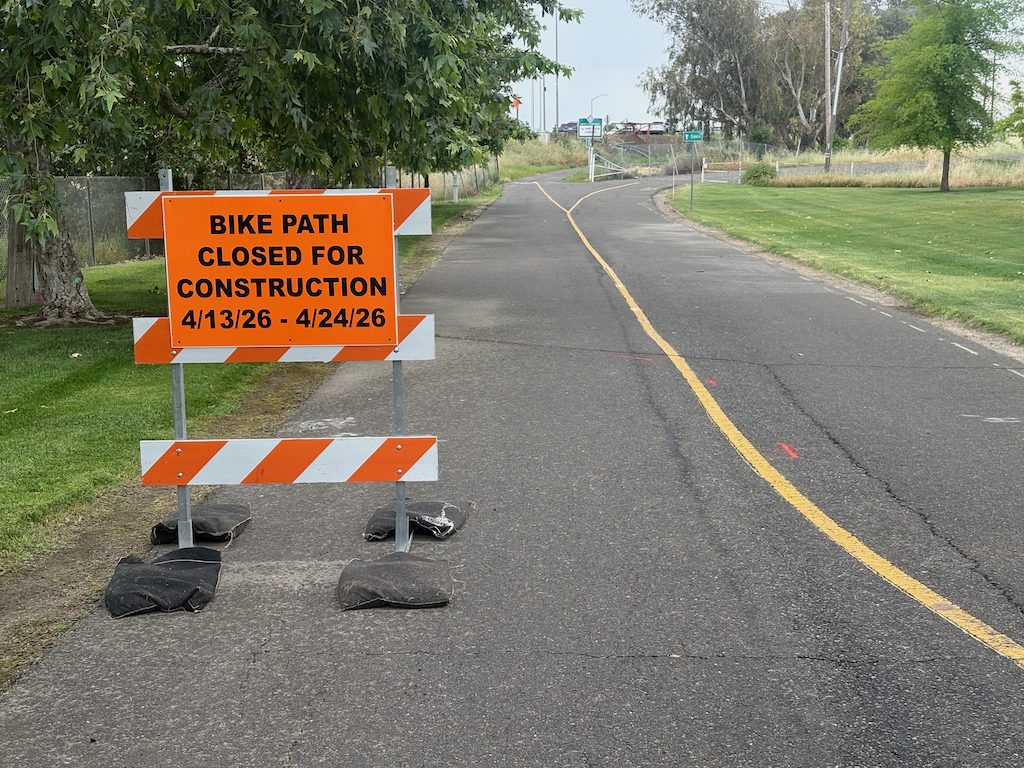
The Yolo causeway bike path will close for a week and a half starting Monday April 13 (tomorrow). The part that will close is actually very short, from the path rest area in West Sacramento to the beginning of the causeway bridge, but since there is no alternative route, the entire distance from West Sac to Davis is closed.
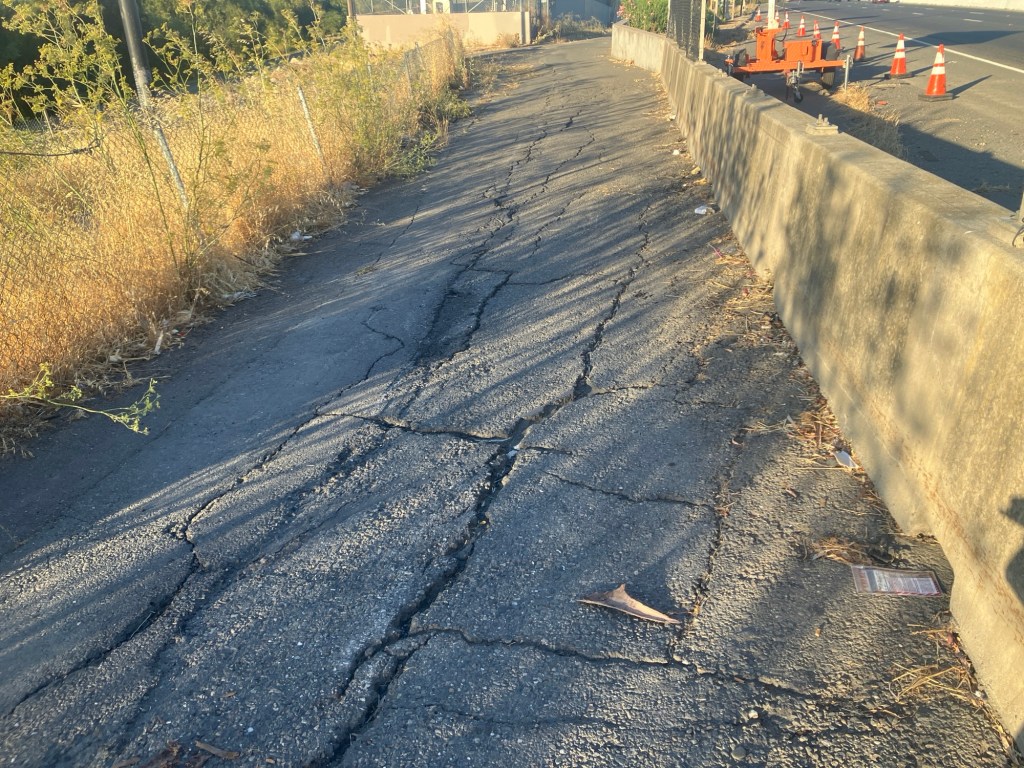
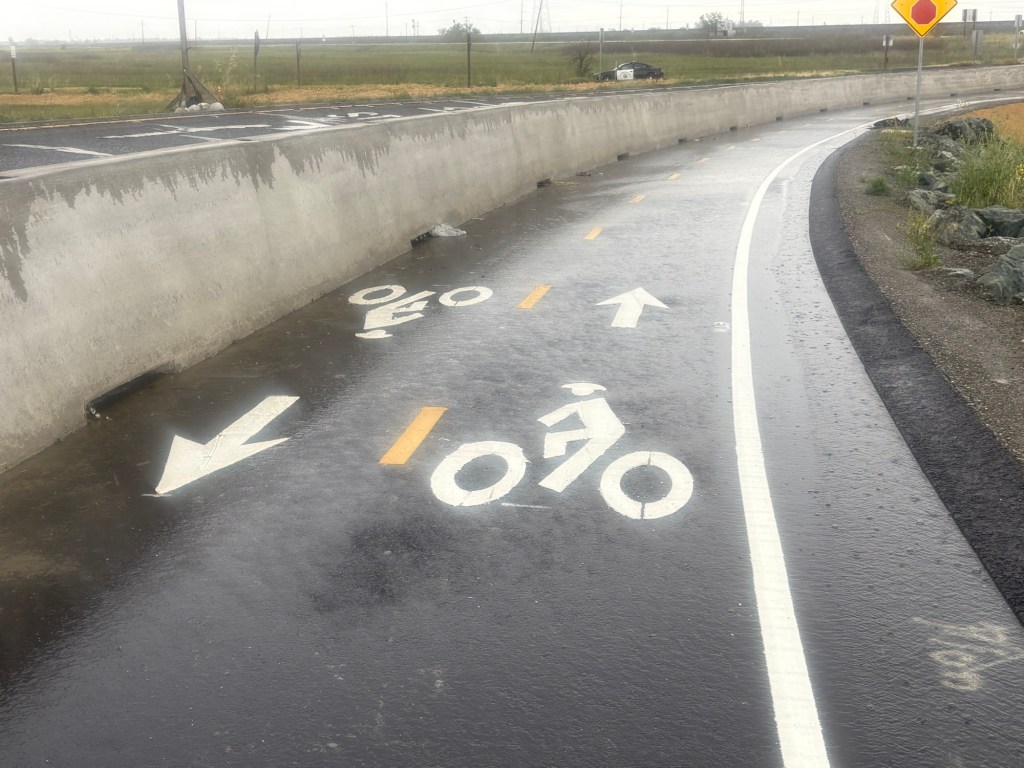
Presumably the closure will be to improve or replace the section of very deteriorated path as it ramps up to bridge level. This is a good thing. The problem is that most users of the path would have no way of knowing beforehand. It is not signed where the path departs West Capitol Avenue westbound, nor is it signed where the path departs County Road 32A eastbound.
Yolo causeway bike path deteriorated pavement
The west end has been improved. Rather than turning on to the levee, it follows the off-ramp from the freeway, protected from motor vehicles by concrete barrier ( sometimes called K-rail or Jersey barrier, but it isn’t clear if this is the term for permanent barriers). However, the junction with County Road 32A is not complete, and may have safety issues.
Yolo causeway bike path approaching County Road 32A
The drainage problems on the causeway portion of the path have not been solved, so there will be extensive puddles after rain, as yesterday. The path continues to collect debris from the highway, car and truck parts and trash. Caltrans passed on the opportunity to provide path lighting, even though electric was embedded in the new barrier. And of course noise from the highway is oppressive. As with all Caltrans projects, two steps forward and one step back.
The H Street Bikeway design has 6 driveways crossing it, 2 on 5th Street to 6th Street, 3 on 6th Street to 7th Street, 1 on 7th Street to 8th Street, and none on 8th Street to 10th Street. Though none of these driveways are heavily used, all are potential conflict points for the bikeway. The 30% design diagrams do not detail how these driveways crossing the separated bikeway will be handled. It is imperative that motor vehicles using the bikeway are moving slowly enough that drivers will see and yield to bicyclists, and bicyclists have time to avoid collisions with drivers who do not yield.
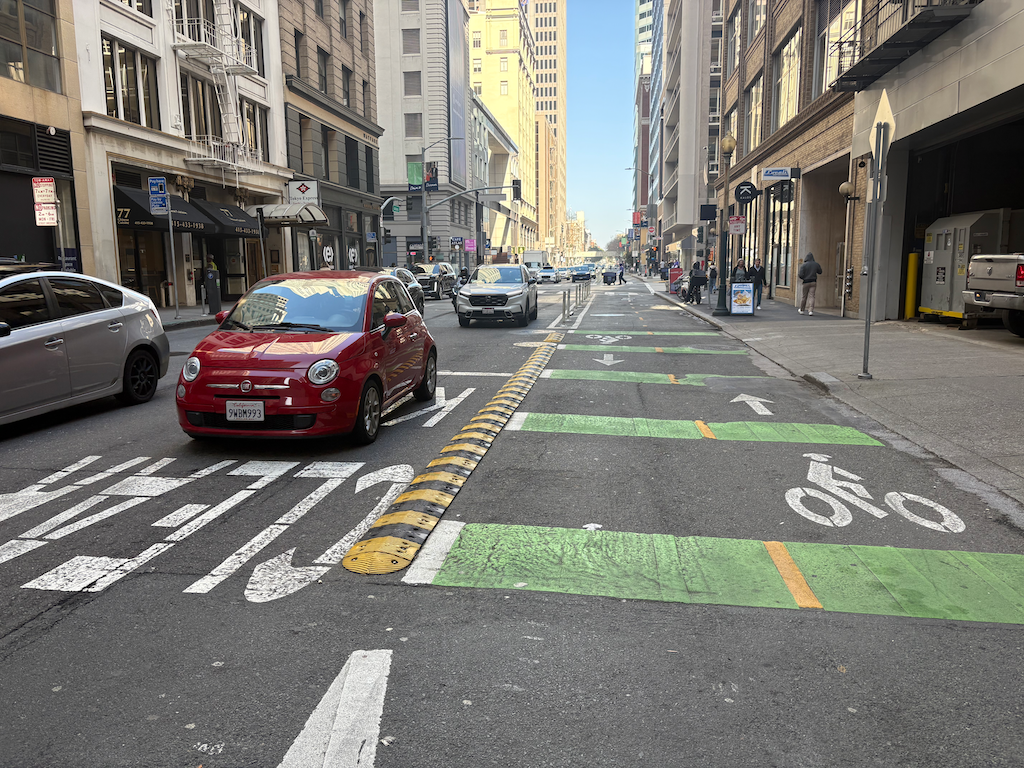
San Francisco has a two-way separated bikeway (cycletrack) on Battery Street in the financial district. Each driveway has speed control devices to ensure that drivers are moving slowly entering and exiting the driveways. The photo below shows one installation, between Pine Street and Bush Street. As a frequent user of this bikeway, I can attest that they are a critical safety feature.
A note about speed bumps. Speed bumps are illegal across roadways in the US. They are most often seen in parking lots, where they are still legal. This use across driveways, and not streets, is legal. The traffic calming devices that are legal across roadways are speed humps, speed cushions, and speed tables.
speed bumps across driveway on Battery St two-way bikeway, San Francisco
A community workshop will be held March 4. See the webpage for details. There is an Eventbrite registration link, though you do not need to register to attend.
You can also sign up for email updates.
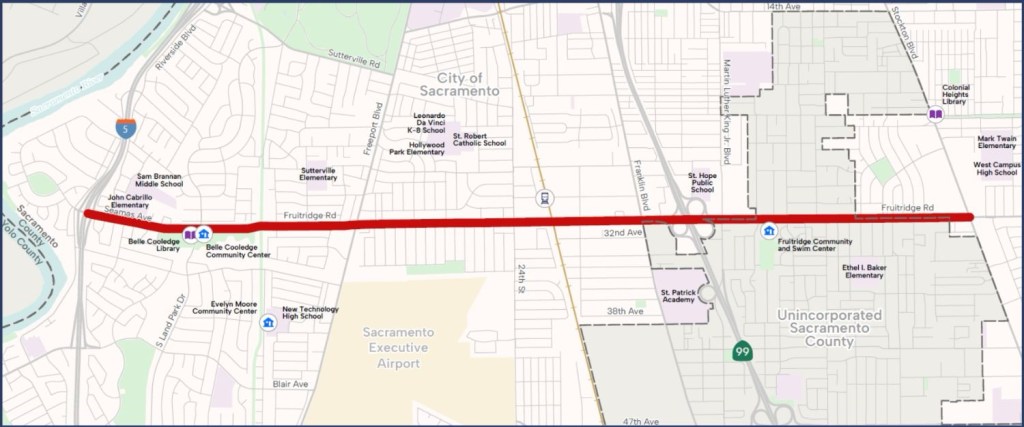
Fruitridge is on the city’s Vision Zero High Injury Network, so attention is appropriate.