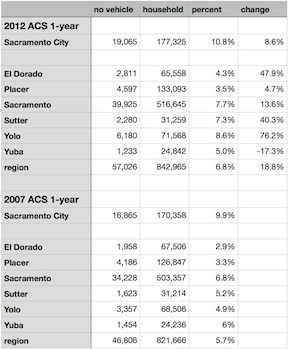
I read with interest the Streetsblog DC post “The American Cities With the Most Growth in Car-Free Households” and wondered about Sacramento. I dove into the American Community Survey, using the same 2012 ACS 1-year and 2007 ACS 1-year data that the research had used to look at the number of car-free households in other cities. Over the period when the national average increased from 8.7 percent share of households without a vehicle to 9.2, the six-county Sacramento region increased from 5.7 to 6.8. Not very impressive, but the change or delta was an impressive 18.8%. Yolo County, probably Davis, led this change with a remarkable 76.2% increase!
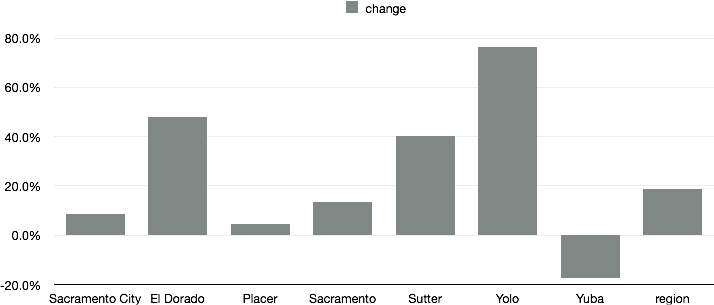
Below is the chart of change from 2007 to 2012, for the City of Sacramento, El Dorado, Placer, Sacramento, Sutter, Yolo and Yuba counties, and the region, which is an average of those six counties. Following the chart are the numbers I retrieved from ACS. If you would like to look for yourself, go to the ACS Advanced Search, and then under Topics select Housing > Occupancy Characteristics > Vehicles Available.
In the blog post, the largest major city increase was Detroit at 5%, and our neighbor San Francisco was sixth at 1.9%.
I’m not quite sure what to make of these numbers. Is there a flaw in my logic? I had to impute the no vehicle households from the total households and percentages for 2007, because the actual number doesn’t seem to be available in the data tables. Were the numbers so small in 2007 that such large changes don’t really mean much? I don’t know. Your thoughts?

Why Do the Smartest Cities Have the Smallest Share of Cars? (Atlantic Cities 2014-01-23)
LikeLike