a trip to San Rafael

Dan Allison, author of this blog, took a trip to San Rafael, California, in north bay Marin County, on Monday of Week Without Driving. To be transparent, I have been car-free for over 13 years, and car-light for about 7 years before that, so a trip on bicycle and public transportation is just the way I live life, not an exploration of the challenge that people who can’t drive face. My income is lower middle income, so I have enough money to travel, at least locally. I went to San Rafael to retrieve my phone charger and battery pack that I’d left on a Marin Transit bus last Wednesday. It took three days for Marin Transit to find the item and get it to lost and found. It was entertaining, and sad, to watch the included AirTag travel around on multiple bus routes. AirTags are bluetooth, so only report when they are close to a modern iPhone, but they do keep showing up in new locations.

So, the Monday trip:

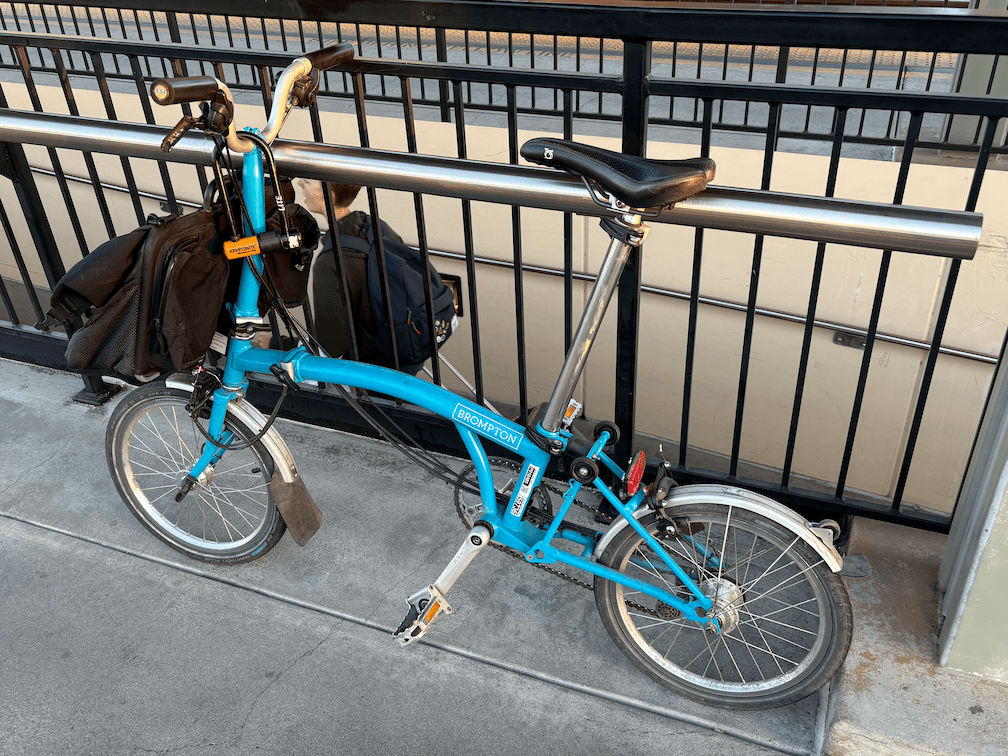
  • bicycle from home to Sacramento Valley Station
  • Capitol Corridor train from Sacramento Valley Station to Richmond Station, $22.95
  • BART from Richmond to El Cerrito del Norte, $0.85
  • Golden Gate Transit bus 580 from El Cerrito del Norte to San Rafael Transit Center, $3.50
  • bicycle to a local coffee shop, where I worked on Week Without Driving communication
  • bicycle to Sprouts Farmers Market for lunch supplies
  • bicycle to Larkspur Ferry
  • Golden Gate Larkspur Ferry to San Francisco, $7
  • bicycle to San Francisco Bay Ferry gate G1
  • San Francisco Bay Ferry to Oakland Ferry, $2.30
  • bicycle to Oakland Jack London Station
  • Capitol Corridor from Oakland to Sacramento, $24.65
  • bicycle from Sacramento Valley Station to home

All of the public transportation was using my senior Clipper Card, on my watch. Capitol Corridor train travel was pre-purchased tickets through the app. The total was $61.25, which is rather expensive for a none day trip, but is quite a bit less than I would have spent driving. At about 83 miles there, and about 105 miles back, using the IRS rate of $0.67 per mile, driving would have cost $126. Plus $17.25 for Golden Gate Bridge and Carquinez Bridge tolls. Most people think only about gas costs, or charging costs, and forget about depreciation, insurance, maintenance, parking, and tolls.

Travel time is hard to compare, since I made so many stops along the way, and did not travel by the most direct route. Looking at the simpler Sacramento to San Rafael trip, driving would be 1 hour 20 minutes, whereas I spent about 2 hours 20 minutes on public transportation.

This is a trip that I’ve taken many times, so there was very little planning involved, and in fact I changed my plans for the leg back home several times on the fly, without problems. Less familiar trips would take more planning.

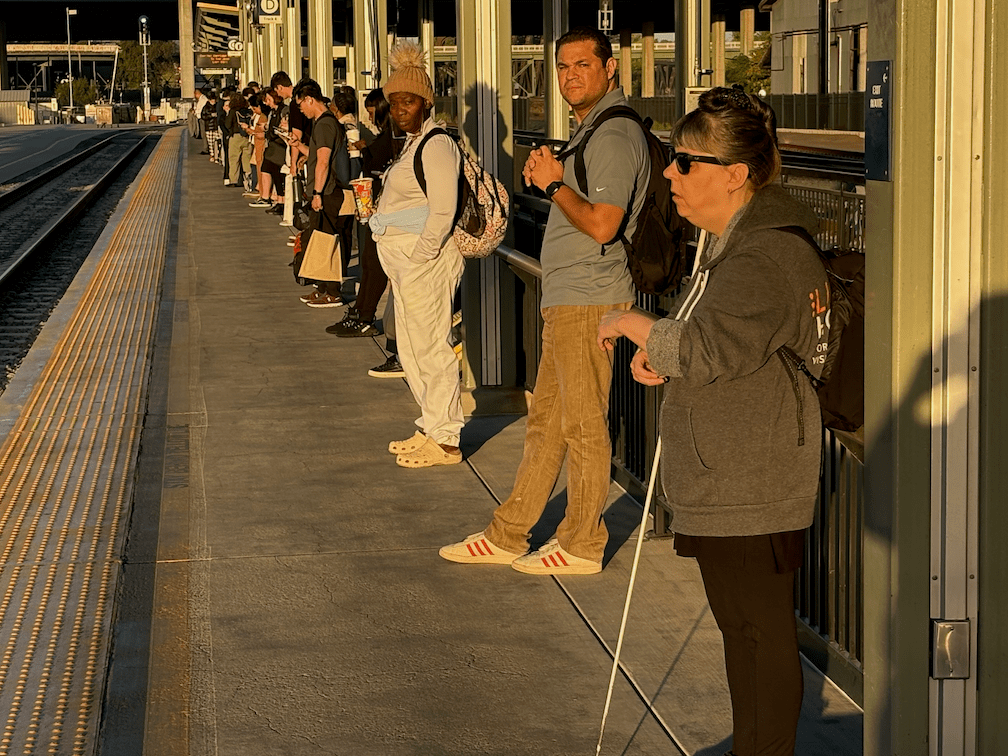
A few photos from my trip are below, but many parts are missing. I’m not used to documenting my public transportation travels, and even less for selfies.

SacRT bus route productivity

Yet another map that may help with understanding the service changes (cuts) proposed by SacRT.

I attended the SacRT board meeting last evening, where there was a presentation by staff on the service changes (agenda item 13), some public comment, and some questions from the board. The gist of the comments and questions seems to be “don’t cut my route,” which is understandable, but doesn’t really advance the discussion much. Mike Barnbaum had the most interesting comments, as he had some innovative ideas for redesigning routes. I briefly presented my design ideas explicated in a previous post (SacRT service changes), and commented that, for the public, the selection of service changes is too much of a black box, input necessary savings, turn the crank, and get out service changes. General Manager Mike Wiley suggested a lot of complex analysis goes into the proposals, addressing in particular questions that were asked by the board about destinations and attractors, however, it isn’t apparent to the public what the criteria are and how they are weighted. Anyway, on with the map.

The map (pdf SacRT_productivity-R2)shows all bus routes for which ridership data is available from the SacRT Monthly Performance Reports page. I selected the last available report, fourth quarter 2015, for weekdays. The variable mapped is “passengers per service hour” which is one of the metrics used to measure productivity, and therefore make decisions about routes, but it is certainly not the only metric. The SacRT minimum goal is 27 passengers, so that is one of the break points, with red and orange routes below that level. Only bus routes are mapped, not light rail, because I am not sure if light rail numbers are directly comparable to bus routes. They are certainly much higher, at least for Blue and Gold, as the trains have a much higher capacity than buses.

SacRT_productivity-R2

I realize that all these maps I’m creating would be more useful if presented all together, in an interface that allows the user to turn them on and off, looking at different combinations. That is a part of ArcGIS that I don’t know yet, so there is perhaps my next learning opportunity.


Getting around… with a knee scooter

I fractured a bone in my right foot on July 7 while backpacking along the Pacific Crest Trail in the Granite Chief Wilderness. I initially thought it was a tendon problem, because I’d had some discomfort with the tendon before, however, in stepping on the outside edge of my foot on a rock, the pain level increased manifold. I walked out on it. On Friday, I went into the doctor, got an x-ray, and now have a lower leg cast. What does this have to do with transportation? Well, I’m now getting around with a knee scooter, rather than walking or bicycling.

It has been interesting, and here is my take on it so far. The knee scooter has small wheels, about eight inches, so it is less stable than a bicycle, or a wheelchair. Because it is somewhat unstable, I use a lot of energy maintaining balance. Though I’ve noticed, now that I’m paying more attention to people using wheelchairs, that the unpowered ones are not all that stable either. But it does move along quickly, faster than walking though not as fast as bicycling.

Read More »

Transit Score

I previously wrote about Walk Score and its use in Sacramento, and now the Walk Score company has released Transit Score. Sacramento ranks 22 out of 25 cities, with a Transit Score of 32 (of 100), in the category of “some transit.” The categories are rider’s paradise, excellent transit, good transit, some transit, and minimal transit. It is worth noting that if all the major cities had provided their transit information, Sacramento would probably have not been on the list at all, because with a population of just under a half million, it is not in the usual top 25 but would show up in a top 50.

Walk Score notes “The Transit Score algorithm calculates a score for a specific point by summing the relative ‘usefulness’ of nearby routes. We define usefulness as the distance to the nearest stop on the route, the frequency of the route, and type of route.” As pointed out in the recent Streetsblog post, it does not including information about where you can go once you’ve gotten onto the transit, which also of course affects the usefulness of the transit.Read More »

Co-op relocation

The Sacramento Natural Foods Coop is considering relocation to 28th and R streets. As a coop member, I’m interested in how the new location addresses transportation. Though plans are preliminary and vague, here is my reaction to what is available so far on the website at http://www.sacfoodcoop.com/index.php?option=com_content&view=article&id=1726:store-relocation-update. Given the stated mission of the co-op, “…consumer-owned […]