For other posts on Fruitridge Road, see category: Fruitridge Road.
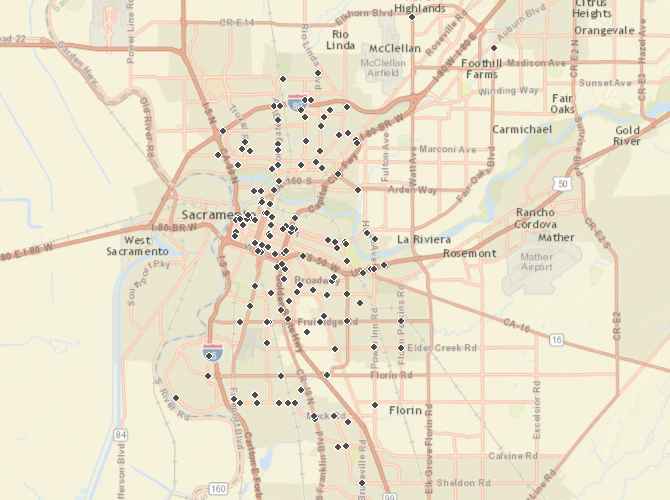
In my main post on the Fruitridge Road Safety and Mobility Plan, I used the collisions map from the existing conditions report. On further reflection, I should have also used the Bicycle and Pedestrian KSI map, below. KSI is ‘killed or severely injured’, so addresses more serious collisions, and not the abundant but less severe collisions that occur on Fruitridge.

For this ten year period, there are four bicycle collisions and 17 pedestrian collisions shown. The pie chart in the existing conditions report certainly justifies a focus on bicyclists and walkers, given that they are a much smaller portion of roadway users than motor vehicle drivers.
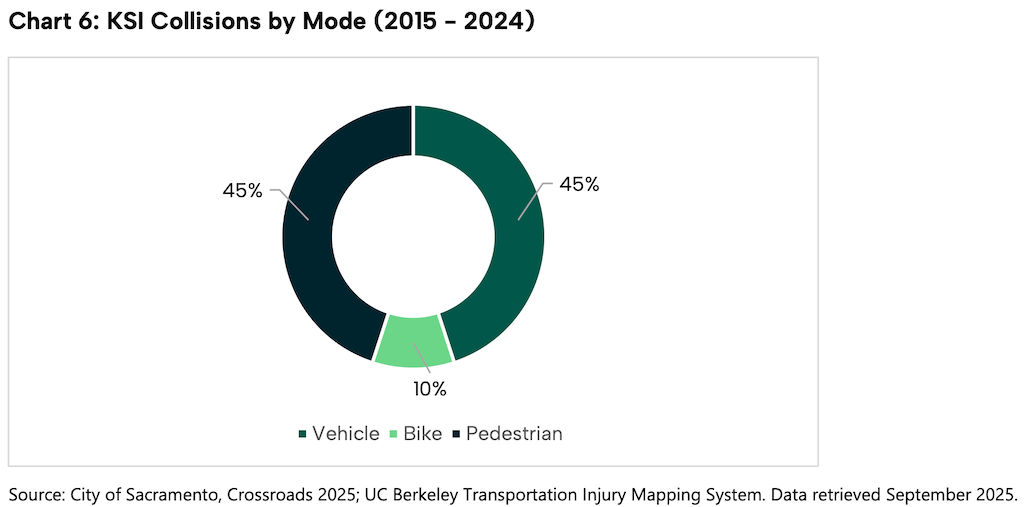
Yet the project as proposed focuses on bicyclists and not much if at all on people walking. In many cases, roadway reallocation gives wider and/or protected space to bicyclists, but it is not clear if sidewalks will be improved at all, and I was unable to find any reference to more frequent safe crossings of the roadway.
While the existing conditions report does not provide detail about these collisions, one could speculate that the two at the Fruitridge Park and Community Center pedestrian crossing is due to drivers ignoring that signal. This crossing is within the county, not the city. Another speculation is that the high density of collision just west of Stockton Blvd is due to the high density of driveways with turning in and turning out conflicts, 53rd Street, and likely people crossing outside crosswalks between the many businesses on the north and south side of Fruitridge, recognizing that the distance between safe marked crossings is too long and encourages crossing in between.
I had thought that I could gather more information on the collisions in the city’s Vision Zero Dashboard and Map, but unfortunately that map and the existing conditions report do not match closely. I don’t know why.