A very slow news week, at least for local transportation.
- Sacramento, Elk Grove to launch ‘Rider Watch’ program on new light-rail line (SacBee 2015-08-11); Back-Seat Driver: “Rider Watch” Planned For New Light Rail Line (SacBee 2015-08-12)
A very slow news week, at least for local transportation.
 I am reading Jarrett Walker’s Human Transit: How Clearer Thinking about Public Transit Can Enrich Our Communities. It is a revelation, and I’ll have more to say about it when I finish. He cautions about using the traditional categories of “choice” riders, those who are not riders but might be if they were better served, and “captive” riders, those who have no choice but to ride public transit. The equivalent is “rich” and “poor,” in that order. I agree with his caution.
But I realized that the categories should be flipped. Choice riders are those who have chosen to live in an area where transit is available, and have chosen not to indebt themselves and their family by owning, maintaining, and operating a motor vehicle. Captive riders are those who have chosen to live in the suburbs and exurbs where they have no choice but to own a motor vehicle, because there is no other way to get around, and no place worth going to, in any case. They are a captive of the choice they’ve made, far less free than someone who lives in a place with transit.

The new protected intersection in Davis, the first in the United States to open, has been in the news recently (#Damien Talks Episode 13 – The Davis Planning Department on the Bike Protected Intersection (Streetsblog), This California city just built the country’s first protected intersection for bikes (Vox), It Just Works: Davis Quietly Debuts America’s First Protected Intersection (Streetsblog), Davis Dutch intersection, first ever in U.S., unveiled with no drama (Davis Enterprise), and others). Though it did not initiate the movement towards protected intersections, which have long existed in some form in Europe, Nick Falbo’s Protected Intersection video has popularized the idea in the United States.
Yesterday I spent about an hour looking at the intersection. It was mid-day, so lightly used by bicyclists, pedestrians and motor vehicles. I might have a different impression at a different time of day. I was on my knee scooter, my current method of getting around, so acting as a pedestrian and not a bicyclist. The design is at the intersection of Covell Blvd and J Street/Cannery Row, on the north side of Davis. The intersection was revised because of the major new development north of Covell, The Cannery, which has recently opened but is still being developed. Some photos are on Flickr.
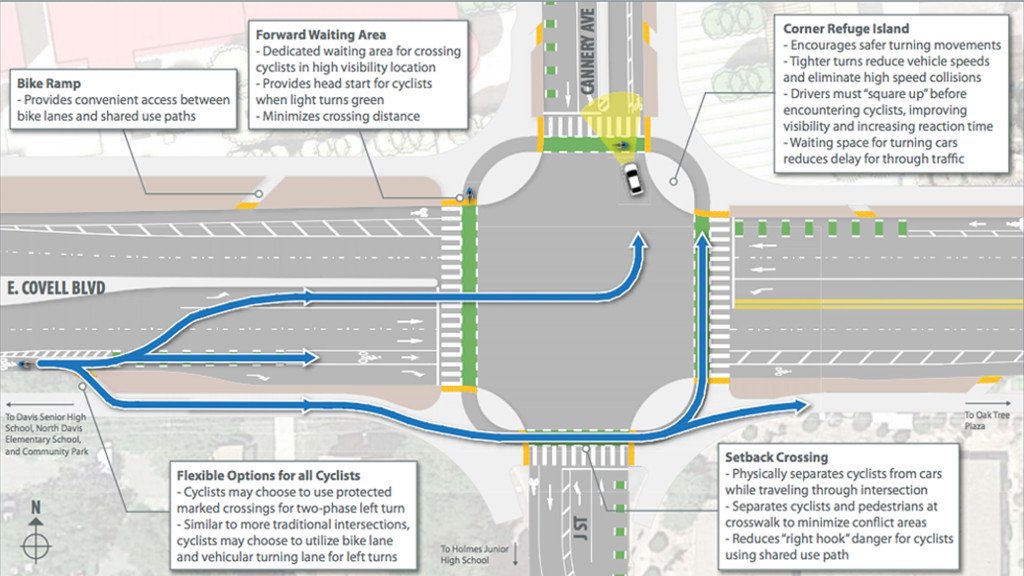
With one exception (below), the intersection worked just fine for all modes. Most bicyclists were on Covell headed east or west, and they used the on-street bike lanes. I saw one person use the ramp up to sidewalk and back down, and one bicyclist use the design to turn left from Covell westbound to J southbound. No issues. I also saw a number of pedestrians crossing in various directions. No issues. The signal cycle is slower than it probably needs to be, but, again, that might be different during commute times.
SacRT is considering a number of extensions to the light rail system, beyond the opening of the Blue Line extension from Meadowview station to Cosumnes River College, which will occur August 24.
These are:
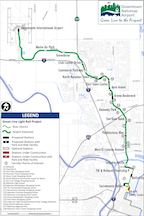 Green Line to the Airport, also known as DNA (Downtown, Natomas, Airport). This project is likely in two phases, first from the current end at Richards Blvd to somewhere in North Natomas, and second the rest of the way to the airport. Information on this project is on the SacRT website. This project is furthest along, and the draft EIS/EIR is now being prepared. The map of the “locally preferred alternative” is at right, and this links to the larger map on the SacRT website.
Each of these extensions are worth exploring in detail, but for now I’m posting because I have two ideas I want to share.
A summary of SacRT issues and my blog posts (even more):
And issues on my list to blog about:
When talking to people about local transportation issues, the subject of SacBAC comes up, and at least half the people say “SacBAC? What is that?” SacBAC is the Sacramento Bicycle Advisory Committee. It is a joint committee formed by the City of Sacramento and the County of Sacramento to advise the respective governments on bicycle issues. It was officially chartered in 1995, and has twelve members, six appointed by the city council and six appointed by the county board of supervisors. It is supported by two staff, the City of Sacramento Bike and Pedestrian Coordinator, Ed Cox, and the County of Sacramento Alternative Modes Coordinator, Dan Klinker. The committee meets once a month, on the second Tuesday, 6:00-8:00PM, in room 1217 of Sacramento City Hall at 915 I Street. The meetings are open to the public.
The agenda for the August 11 meeting is available.
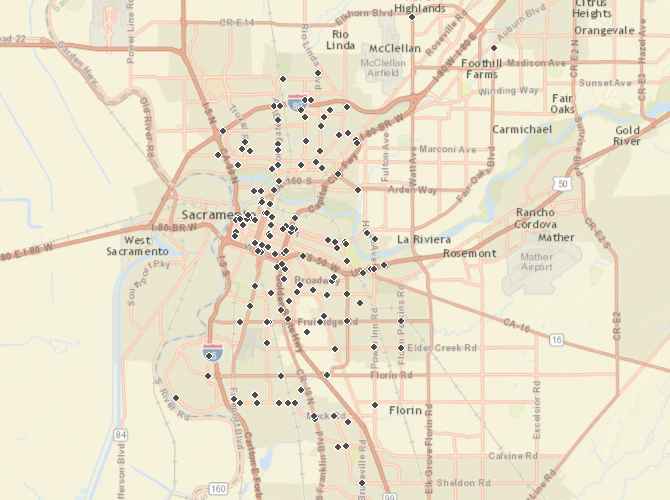
This post complements my recent post on pedestrian collisions in Sacramento. Please see that post for details about data sources (SWITRS GIS Map in TIMS) and mapping.
The collisions mapped are:
The overall number of bicyclist collisions in the killed or severe injury category over this nine year period is low enough that patterns may not accurately represent hazardous roadways since a small number of collisions can significantly change the pattern.
The first map, a point map of the entire city, shows:
I just ran across an interesting piece of data that I was not aware of before, in Motor Vehicle Crash Deaths in Metropolitan Areas — United States, 2009. Sacramento area ranks 8.3/100,100 for motor vehicle related crash deaths, but 14.4 for the city, which is in the middle of pack for the US, but worse than most of California. Riverside area is 10.6 and city 11.9, San Diego area 7.8 and city 5.6, San Francisco area 5.6 and SF 4.0 and Oakland 5.0, Los Angeles area 6.6 and Los Angeles city 7.7 and Long Beach 6.1 and Anaheim 7.8. This 2009 data, and I could not find anything from CDC more recent. For contrast, London is 1.6 and New York is 3.2, both considered dangerous places in the mis-informed public mind.
The Keys to Designing Cities With Fewer Traffic Fatalities (CityLab 2015-07-23)
