Slow Transportation (part 1)

Recently I was emailing a friend about a Slow Food gathering, and facetiously used the term “slow transportation” for getting there by train rather than flying. But the more I thought about it, the more the term resonated with what I believe in and what I work on. I have not heard, so far as I’m aware, the term used anywhere else, but I think readers of this blog will immediately resonate with it as well. What follows is a first attempt to pin down a working definition of Slow Transportation.

I am going to break this topic up into several posts, but at the end I’ll make it available as a single document in case that is of use to you.

1. What is wrong with our present transportation system?

I am going to keep the list short and succinct because I think most readers of this blog will either already be aware of the issues, and/or will agree that these are the problems. Entire books have been written about each of these issues!

Note: Don’t be depressed by the list of problems below. I promise I won’t leave you there for long.

  • transportation accounts for a significant part of greenhouse gas emissions (37% in california, 26% in the US, and 14% worldwide) as is therefore a major driver of climate change
  • we have emphasized mobility over access, the ability to get somewhere – anywhere, rather than the ability to get to places we want to go; there is an incredible amount of aimless driving, just for something to do, running a small errand to take up time and fill an empty life; only about 15% of car trips these day have anything to do with commuting to work
  • the convenience and low cost of driving has encouraged the separation of functions, where we live, work, recreate and socialize, diminishing the value of each place; though this has started to reverse, we are so far down this road (literally) that it will be hard to bring these back together
  • privately owned motor vehicles isolate people rather than bring them together
  • traffic violence is inherent in a system based on private motor vehicles; even when people are not killed and injured by the drivers of motor vehicles, they are still intimidated out of the public space, knowing they are at risk there and are being actively discriminated against
  • our cities, counties and states are either already insolvent or on their way to insolvency, in part due to the fact that we do not have and cannot ever have enough money to maintain the transportation infrastructure we have already built; though roadways are the worst of this, it is also true to some degree of transit systems, and most certainly our air transport system
  • our current wars are in significant part about oil, oil wars; if you don’t think this is so, ponder the fact that the former head of Halliburton, an oil exploration and facilities company, got us into the Iraq war and Halliburton was the prime contractor for that war; it is not just the US with guilt and blood, most of the wars today are at least in part about oil
  • we transport our food long distances, disconnecting us from the source, the soil, and the people who grow it; industrial agriculture is both dependent on and a driver (literally) of our unsustainable transportation system; again, this is starting to reverse, but we have lost much of the smaller farmer and small processor capacity of our country, and it will take time to rebuild
  • the housing affordability crisis is in part due to a focus on housing costs without considering the transportation costs; the Center for Neighborhood Technology’s H+T calculations indicates that much of the current housing stock is unaffordable because it is located so far from jobs and amenities; it is not really the urban areas (so much in the news) where housing is unaffordable, since transportation costs there are so much lower, but the suburbs and exurbs
  • our transportation system takes up too much of our wealth, particularly in the preference for mega-projects like new bridges and freeways, and inattention to small projects that would have greater benefits; there are plenty of things we could be spending transportation money on instead; I dont’ want to minimize the value of transportation investments, but to ask that they have the a similar social return to other things we could spend on
  • our transportation system takes up too much of our space, not just with roadways and interchanges, but with parking garages and parking lots and on-street parking; as a result of all this space devoted to one mode of travel, the private vehicle, everything must be further apart, thereby requiring even more driving, in an ever-downward spiral
  • our transportation system both encourages and depends upon greenfield development, which leads directly to loss of wildlife habitat and agricultural lands; we already have enough housing stock, but a preference for heavily subsidized greenfield development leads to abandonment and neglect of the sufficient housing stock we already have; greenfield development must stop, now and forever
  • there are so many externalities to private car use, costs that are borne by other individuals and society as a whole, that it really amazes me that we even allow private car use
  • we have reached peak car; peak does not necessarily mean the greatest number of cars or the greatest vehicle miles traveled, but it means the point of diminishing returns; the costs are now overwhelming the benefits and nothing we do can change that, except to walk away (literally) from dependence on motor vehicles

“The automobile has not merely taken over the street, it has dissolved the living tissue of the city. Its appetite for space is absolutely insatiable; moving and parked, it devours urban land, leaving the buildings as mere islands of habitable space in a sea of dangerous and ugly traffic.” —James Marston Fitch, New York Times, 1 May 1960

roads in California and Sacramento County

In preparation for some exploration of funding sources for roads, it helps to see what the situation is with the jurisdictions and types of roads, for mileage and VMT.

Jurisdiction means the level of government responsible for the road. This is not always clear from simply looking at a road. If there is a federal or state highway sign, it is pretty clear, but there are roads that are part of the state highway system that are not signed as such.

The types of roads, here, means functional classification, which is a federal designation of Interstate, Principal Arterial – Other Freeways and Expressways, Principal Arterial – Other, Minor Arterial, Major Collector, Minor Collector, and Local. Again, it is not always easy to distinguish classification, but as a generality, freeways fall into the first two, major roads such as Folsom Blvd and Watt Ave fall into the third, busy wide streets are the next three, and residential streets are the last. Another useful classification is that the first six categories are roads, meant to move motor vehicle traffic, and the last is a street, meant to provide access to residences and small businesses. Unfortunately, we build far too many of the road variety and then put business on them so they no longer function well to move cars. See Strong Towns for a more detailed explanation of roads, streets, and stroads.

Read More »

Parking and transit, and ride sharing

Streetsblog posted today information from a City Observatory project that compares the cost of parking to the level of transit use, and the cost of parking to the number of ride-hailing (Uber, Lyft) users: What the Price of Parking Shows Us About Cities.

pking_v_transit
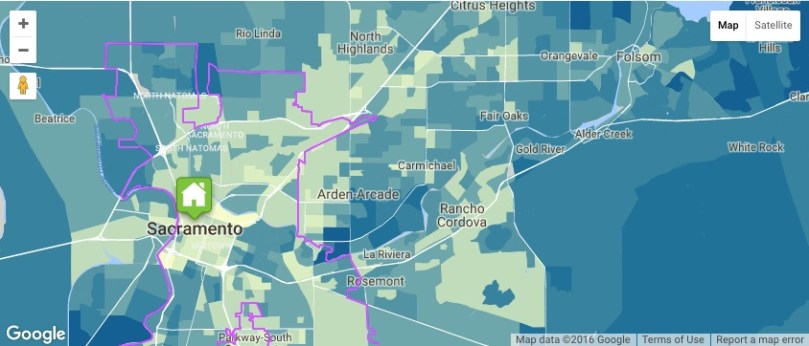
Sacramento (highlighted dot, which is otherwise hard to find):

Perhaps transit supporters should be specifically advocating for increased parking fees, though the position of Sacramento on the graphs, above the trend line, indicates that there are additional factors in Sacramento that suppress transit use.

Myth?: transit takes longer

“But, what is more important is that only a small portion of jobs, and other destinations can be accessed through transit in any reasonable time and the travel time for transit is far higher than for driving.”

Well, this one is much more true that the myths I addressed (Myth: housing more expensive in dense areas, Myth: driving is supported by user fees). But it is worthwhile analyzing why this is so.

There are four employment centers in our region: downtown Sacramento, Rancho Cordova, Folsom, and Roseville. However, downtown is by far the most important. Check yesterday’s post (SacRT and employment) to see what a remarkable concentration of jobs there is, and how much of the county is essentially empty of jobs. Downtown is easily accessible by transit, the other three have much more limited options. So, how about time? Yes, there is a big time difference.

Three examples of morning commutes:

  • Greenback/Sunrise to downtown: 78 minutes by transit (bus route 21 and Gold Line) while Google reports driving is typically 35 minutes but can be 70 minutes. So on a bad traffic day, the two modes are comparable, but on a good traffic day driving is more than twice as fast.
  • Zinfandel/Sunrise to downtown: 61 minutes by transit (Gold Line and some walking) while Google reports driving as typically 22 minutes but can be 45 minutes. Again, driving is more than twice as fast.
  • Florin/Greenhaven to downtown: 30 minutes by transit (route 6), while Google reports driving as typically 10-16 minutes. Again, driving is more than twice as fast.

So, back to why. The nature of buses is that they have frequent stops, and spend a significant portion of their time in dwell, not moving. Light rail has fewer stops, so spends less time in dwell. There are express buses, of which SacRT has a few that run very limited schedules. It is also possible to create Bus Rapid Transit (BRT) routes with few stops, and travel times close to light rail. The commuter buses operated into downtown by Placer County, El Dorado County, Elk Grove, Roseville and others have only a few stops at each end, with long runs in between, and so have travel times as good as or better than light rail and BRT. However, these commuter buses serve a much smaller number of riders than any of the other options, and are also quite a bit more expensive than SacRT fares.

A second big difference it that you don’t have to wait for the next bus or light rail. You jump in your car and go. Of course there is time parking at the destination (an urban area typically sees about one-third of traffic is circling for parking, and my observation says Sacramento is similar. I live very near the CDPH buildings, and when I’m home during the day, I see a lot of employees walking to their cars to pay more or move them. More time time lost to the driving habit.

Perhaps the biggest difference is the amount of money we spend on driving, both individually and as a society. A transit pass costs $120 per month. Commuting can cost many times that much (before you say but… realize that almost all drivers underestimate what their vehicle really costs them). As a society, we spend incredible amounts of money on highways, far, far more than we spend on transit. One data point is the $133 million “80 Across the Top” project which is adding just a single travel lane in each direction for about 10 miles. $133 million for a lane. Wow! I have previously estimated the cost of the freeway system in Sacramento county as about $1 trillion. I don’t have a cost estimate for the light rail system, but it is a tiny fraction of this. What if we had spent the money on transit instead of privately owned vehicles? How would travel times compare then? We have created a transportation system whose primary purpose is to move a lot of cars at high speed. We have not created a transit system move a lot of people at a reasonable speed.

Myth: housing more expensive in dense areas

Todd Litman recently gave a talk at Transit 101 presentation hosted by 350Sacramento and others. There were some comments afterwards questioning some of what he had to say and his premises.

One of these was “He also ignores that the type of concentration he is advocating significantly increases the cost of housing.” Litman did present densification as one of the solutions to transit systems that are too spread out to function effectively, which is certainly one of the issues for SacRT.

If one looks only at the price of housing, the cost does usually increase as one moves from the suburbs towards the urban core. Though the pattern is actually much more complicated than that, with some inner-ring suburbs doing quite well while others are in steep decline. But the price of housing is only one aspect of living costs. The big, and often forgotten or dismissed, cost is transportation.

The key resource for exploring the tranportation aspects of housing affordability is the H+T Index (housing plus transportation) of the Center for Neighborhood Technology. To quote:

By taking into account the cost of housing as well as the cost of transportation, H+T provides a more comprehensive understanding of the affordability of place. Dividing these costs by the representative income illustrates the cost burden of housing and transportation expenses placed on a typical household. While housing alone is traditionally deemed affordable when consuming no more than 30% of income, the H+T Index incorporates transportation costs—usually a household’s second-largest expense—to show that location-efficient places can be more livable and affordable.”

The map below shows the H+T index for a part of the Sacramento area. Light colors are affordable, dark colors are not. The general pattern is that housing becomes less affordable the further one goes from the urban core, though the pattern is of course complex. Part of Arden-Arcade is unaffordable both because housing is very expensive and it is a transit desert, while other parts are more affordable because housing is less expensive and it is not quite as much of a transit desert.

CNT_sac-HT

The devil is in the details, so I’d encourage you to explore the maps at CNT in more detail to see how this calulation works for specific areas, and how the H only (housing only) map compares to the H+T (housing plus transportation) map. I’ve written a bit about H+T before (Abogo), but it is always worth coming back to these very important concepts.

A lot of what people think about when they think about high costs in dense places are the really dense places, New York, Paris, San Francisco. However, the high costs of those places has as much to do with demand as with density. These places are expensive because so many people want to live there, and with limited housing options, competition drives prices up. In fact, the lower costs of suburban housing can be explained in large part by the far lower demand for such places. Not many people want the suburbs, so there is little competition for housing there, and prices stay lower. This is an oversimplification, but nevertheless true, and one of the perspectives that needs to be considered when looking at housing prices.

Another aspect of this misunderstanding is that many people envision densification as leading inevitably to very dense urban areas, which they associate with poor livability (though others seek out these dense areas), what are sometimes called inner cities, skyscrapers and tenements. Densification can mean intermediate densities, such as houses on smaller lots, multi-family housing, and buildings of moderate height up to five stories. Of course some people don’t like that either, but this is the minimum necessary for a functional transit system. The “new-traditional” format of houses on large suburban lots, or even worse, very large houses on very large exurban lots, cannot support a transit system. In the Sacramento area, midtown is an example of a moderate density place. It has single family homes, but also multi-family houses, apartment complexes, low-rise residential buildings, a good mix of housing types. And it is hardly dense at all, at least in my view.

Beyond the direct costs to the invidual homeowner/renter, however, are the costs we pay in sales tax and property tax, as well as fees, to build and maintain infrastructure. Infrastructure in less dense areas costs much more per household, or per square foot of floor space. Everything is longer in the suburbs: power lines, water lines, sewer lines, telephone/cable TV lines, roads, freeways, and most specifically distance to amenities. Everything. So far we have hidden that cost by having everyone pay equally for infrastructure, but if people were charged both for initial construction and maintenance by the amount of infrastructure per household or square foot, people who live in the suburbs would be paying much more for their services. As it should be. In fact, most of the suburbs are financially unsustainable since they can never generate enough sales tax, property tax, or fees to pay for what it really costs. That is in part why the suburbs are falling apart – there simply isn’t enough money to keep them going.

The cost of living in denser areas is less, the cost of living in less dense areas is more.

SacRT frequency and stops

Two more maps for your viewing pleasure.

The route frequency map classifies routes by their frequency of service, as 12, 15, 20, 30, or 60 minute frequency. Mostly, this means service from 6:00AM to 7:00PM, though it is shorter in a few cases and longer in several cases. Peak only routes are not shown at all. Map below and pdf SacRT_frequency.

SacRT_frequency

The other map is a different view of the routes, shown as stops with quarter mile buffers (one of the often-used walking distance to transit stop criteria, though of course some will walk further, some less, and bicycling distances are much greater. Though at this scale, the map is not significantly more interesting than the simple route map, when zoomed in, there are some very interesting patterns. I see places with stops placed closer than need be, and some places with stops placed too far apart. I’m playing with an alternate version that also shows the population density data, but not ready with that one. Map below, and pdf SacRT_stops. This is one of the first ones that I will try to put up on ArcGIS Online since it really benefits from zooming.

SacRT_stops

SacRT bus route productivity

Yet another map that may help with understanding the service changes (cuts) proposed by SacRT.

I attended the SacRT board meeting last evening, where there was a presentation by staff on the service changes (agenda item 13), some public comment, and some questions from the board. The gist of the comments and questions seems to be “don’t cut my route,” which is understandable, but doesn’t really advance the discussion much. Mike Barnbaum had the most interesting comments, as he had some innovative ideas for redesigning routes. I briefly presented my design ideas explicated in a previous post (SacRT service changes), and commented that, for the public, the selection of service changes is too much of a black box, input necessary savings, turn the crank, and get out service changes. General Manager Mike Wiley suggested a lot of complex analysis goes into the proposals, addressing in particular questions that were asked by the board about destinations and attractors, however, it isn’t apparent to the public what the criteria are and how they are weighted. Anyway, on with the map.

The map (pdf SacRT_productivity-R2)shows all bus routes for which ridership data is available from the SacRT Monthly Performance Reports page. I selected the last available report, fourth quarter 2015, for weekdays. The variable mapped is “passengers per service hour” which is one of the metrics used to measure productivity, and therefore make decisions about routes, but it is certainly not the only metric. The SacRT minimum goal is 27 passengers, so that is one of the break points, with red and orange routes below that level. Only bus routes are mapped, not light rail, because I am not sure if light rail numbers are directly comparable to bus routes. They are certainly much higher, at least for Blue and Gold, as the trains have a much higher capacity than buses.

SacRT_productivity-R2

I realize that all these maps I’m creating would be more useful if presented all together, in an interface that allows the user to turn them on and off, looking at different combinations. That is a part of ArcGIS that I don’t know yet, so there is perhaps my next learning opportunity.


SacRT routes & population density

SacRT with density and income

Investigating the proposed SacRT service changes (cuts), I identified that routes serving low density areas are a problem. I developed the map below (pdf SacRT_pop-density) showing routes and population density, with low density areas shown in red. Two routes stand out as servicing primarily low density areas, which are unlikely to ever be productive in a ridership sense. In fact, one of the reasons SacRT struggles to provide efficient transit service is the low-density nature of the county. Though of course agricultural areas north and south of the urbanized area will be low density, there are also large areas of low-density suburb and exurb (sprawl) which will never be successful. Every greenfield development allowed by the county and cities just exacerbates this problem

The population data is from the American Community Survey (ACS) 2014 5-year estimate (S1903), selected by census tract and matched to census tract outlines provided by SACOG, showing residents per square mile. The routes are from the Google Transit Feed Specification (GTFS) provided by SacRT. All routes are shown, including commute hours, low frequency, moderate frequency, and high frequency routes, as well as routes operated by SacRT under contract with others. It would be more useful to identify and/or separate out different kinds of routes, but it takes a while to compile that data, and I’m not quite there yet.

Read More »

SacRT service changes

Sacramento Regional Transit (SacRT) has proposed service changes, primarily elimination of routes, most of which would go into effect January 2017, with a few before that and more after than. The proposal is available (summary chart after the jump), and a more detailed analysis is in the Board of Directors agenda (Item 13) for the May 23 meeting. At the May 23 board meeting, the service changes will be an informational item, not a decision. Five open houses on the service changes were scheduled, two of which have occurred, with three yet to go. I attended the open house at SacRT headquarters on May 17.

I was asked for my thoughts on the service changes. Below is a bullet summary, followed by the nerdy details.

  • SacRT should make the boardings dot map available to the public. It is the best information I’ve seen to indicate which routes are productive, and which not, more understandable to the public than the tables of numbers in the proposal. Additionally, all maps showing routes, including of course the system map, should have an indication of the service frequency, either by color or weight. The “all routes looking the same” maps that SacRT currently uses do not communicate this critical piece of information.
  • A portion of savings from elimination or combination of routes should be reinvested in other routes which could be moved from acceptable productivity to higher productivity with frequency, service hours, or routing improvements.
  • Reductions in frequency are counter-productive, usually making a route with challenges into a failing route, which will then be identified in a future round of service changes for elimination.
  • Routes serving low density residential and semi-rural areas should be cut before routes serving moderate to high density residential areas.
  • Combining routes for more efficient coverage, particularly where routes overlap or are very closely parallel, is a good idea.
  • Saturday service should be retained on all routes. Transit-dependent riders who work the usual weekday work week must have service on at last one weekend day so that they can grocery shop, visit friends and family with less mobility, and seek medical care.
  • Routes should not be eliminated for at least two years after creation or significant revision. Time is needed to see ridership trends once people in a community adjust to the service. Specifically, this means: do not eliminate Route 65 Franklin South.
  • The concept that routes should focus on light rail connections rather than radial routes to downtown, or point-to-point routes, should be considered in all route decisions.
  • SacRT should do a complete system re-visioning within the next four years. A series of cuts, and even transit renewal, has left a system that is inefficient and probably unjust. It should be redesigned from scratch.

Read More »

A conference done right

I attended the Transportation Equity Summit in Sacramento today. Unfortunately work obligations will prevent me from attending the advocacy day tomorrow. I’d like to comment on the conference.

Though short, the conference was GREAT. In the lunch-time plenary session, three good speakers laid out some basics, but plenty of time was reserved for questions from the moderator and the audience. This was followed by a half hour networking session (with coffee and cookies), then three breakout sessions, then another networking break with tea and cookies, and two final breakout sessions. In the two breakouts I attended, at least one-third of the time was devoted to questions from the participants. In the evening there was a social function at the hostel, with a brief but very interesting presentation, three short awards, and much more networking over beer and wine.

This is the way a conference should be done. Too many conferences in Sacramento over the last few years, on transportation and livability topics, seemed to intentionally exclude participation. The speakers filled up all the available time, there was no planned time for networking, and the overall feeling was that the experts were telling the rest of us what we needed to know (the sage on the stage), though ironically there was far greater expertise in the audience than on the stage. It is my hope that we never need suffer another one of those authoritarian conferences in Sacramento, and that the Transportation Equity Summit sets a bar that all others must now reach. If you have the opportunity to participate in future transportation related conferences in Sacramento (or anywhere), I hope that you will ask very tough questions about the program format before you sign up, and if the conference is clearly not going as advertised, stand up and object strenuously, and in fact make sure the conference doesn’t proceed until it is fixed. Obviously I have strong feelings about this. I’ve been burned by the lies of conference organizers, and will not ever trust many of them again.

Thank you to Transform and California Bicycle Coalition, their leaders, and Katie for a great conference, done professionally, and inclusively, and with humanity.