SacRT bus route productivity

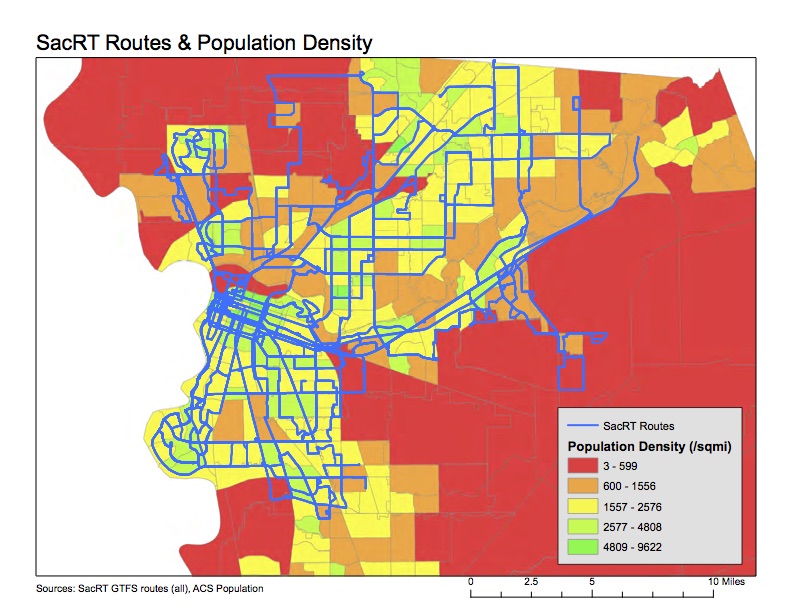
Yet another map that may help with understanding the service changes (cuts) proposed by SacRT.

I attended the SacRT board meeting last evening, where there was a presentation by staff on the service changes (agenda item 13), some public comment, and some questions from the board. The gist of the comments and questions seems to be “don’t cut my route,” which is understandable, but doesn’t really advance the discussion much. Mike Barnbaum had the most interesting comments, as he had some innovative ideas for redesigning routes. I briefly presented my design ideas explicated in a previous post (SacRT service changes), and commented that, for the public, the selection of service changes is too much of a black box, input necessary savings, turn the crank, and get out service changes. General Manager Mike Wiley suggested a lot of complex analysis goes into the proposals, addressing in particular questions that were asked by the board about destinations and attractors, however, it isn’t apparent to the public what the criteria are and how they are weighted. Anyway, on with the map.

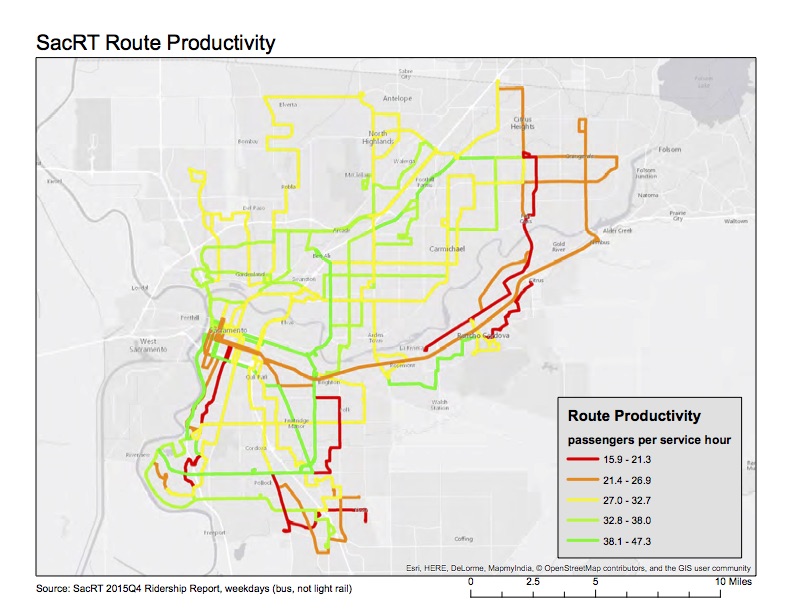
The map (pdf SacRT_productivity-R2)shows all bus routes for which ridership data is available from the SacRT Monthly Performance Reports page. I selected the last available report, fourth quarter 2015, for weekdays. The variable mapped is “passengers per service hour” which is one of the metrics used to measure productivity, and therefore make decisions about routes, but it is certainly not the only metric. The SacRT minimum goal is 27 passengers, so that is one of the break points, with red and orange routes below that level. Only bus routes are mapped, not light rail, because I am not sure if light rail numbers are directly comparable to bus routes. They are certainly much higher, at least for Blue and Gold, as the trains have a much higher capacity than buses.

SacRT_productivity-R2

I realize that all these maps I’m creating would be more useful if presented all together, in an interface that allows the user to turn them on and off, looking at different combinations. That is a part of ArcGIS that I don’t know yet, so there is perhaps my next learning opportunity.


SacRT with density and income

Investigating the proposed SacRT service changes (cuts), I identified that routes serving low density areas are a problem. I developed the map below (pdf SacRT_pop-density) showing routes and population density, with low density areas shown in red. Two routes stand out as servicing primarily low density areas, which are unlikely to ever be productive in a ridership sense. In fact, one of the reasons SacRT struggles to provide efficient transit service is the low-density nature of the county. Though of course agricultural areas north and south of the urbanized area will be low density, there are also large areas of low-density suburb and exurb (sprawl) which will never be successful. Every greenfield development allowed by the county and cities just exacerbates this problem

The population data is from the American Community Survey (ACS) 2014 5-year estimate (S1903), selected by census tract and matched to census tract outlines provided by SACOG, showing residents per square mile. The routes are from the Google Transit Feed Specification (GTFS) provided by SacRT. All routes are shown, including commute hours, low frequency, moderate frequency, and high frequency routes, as well as routes operated by SacRT under contract with others. It would be more useful to identify and/or separate out different kinds of routes, but it takes a while to compile that data, and I’m not quite there yet.

Continue reading “SacRT with density and income”

SacRT service changes

Sacramento Regional Transit (SacRT) has proposed service changes, primarily elimination of routes, most of which would go into effect January 2017, with a few before that and more after than. The proposal is available (summary chart after the jump), and a more detailed analysis is in the Board of Directors agenda (Item 13) for the May 23 meeting. At the May 23 board meeting, the service changes will be an informational item, not a decision. Five open houses on the service changes were scheduled, two of which have occurred, with three yet to go. I attended the open house at SacRT headquarters on May 17.

I was asked for my thoughts on the service changes. Below is a bullet summary, followed by the nerdy details.

  • SacRT should make the boardings dot map available to the public. It is the best information I’ve seen to indicate which routes are productive, and which not, more understandable to the public than the tables of numbers in the proposal. Additionally, all maps showing routes, including of course the system map, should have an indication of the service frequency, either by color or weight. The “all routes looking the same” maps that SacRT currently uses do not communicate this critical piece of information.
  • A portion of savings from elimination or combination of routes should be reinvested in other routes which could be moved from acceptable productivity to higher productivity with frequency, service hours, or routing improvements.
  • Reductions in frequency are counter-productive, usually making a route with challenges into a failing route, which will then be identified in a future round of service changes for elimination.
  • Routes serving low density residential and semi-rural areas should be cut before routes serving moderate to high density residential areas.
  • Combining routes for more efficient coverage, particularly where routes overlap or are very closely parallel, is a good idea.
  • Saturday service should be retained on all routes. Transit-dependent riders who work the usual weekday work week must have service on at last one weekend day so that they can grocery shop, visit friends and family with less mobility, and seek medical care.
  • Routes should not be eliminated for at least two years after creation or significant revision. Time is needed to see ridership trends once people in a community adjust to the service. Specifically, this means: do not eliminate Route 65 Franklin South.
  • The concept that routes should focus on light rail connections rather than radial routes to downtown, or point-to-point routes, should be considered in all route decisions.
  • SacRT should do a complete system re-visioning within the next four years. A series of cuts, and even transit renewal, has left a system that is inefficient and probably unjust. It should be redesigned from scratch.

Continue reading “SacRT service changes”