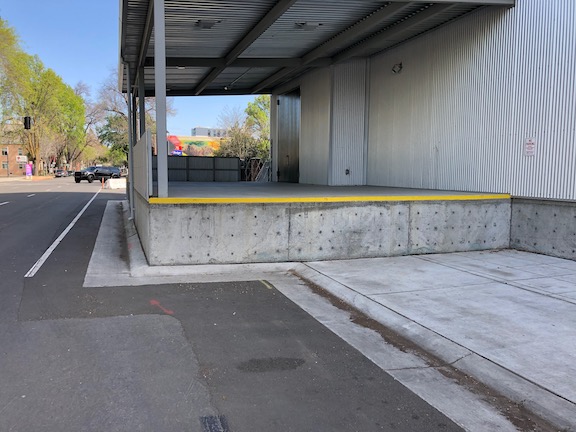
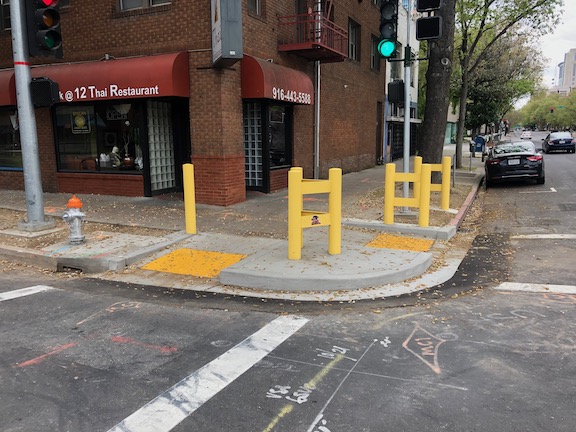
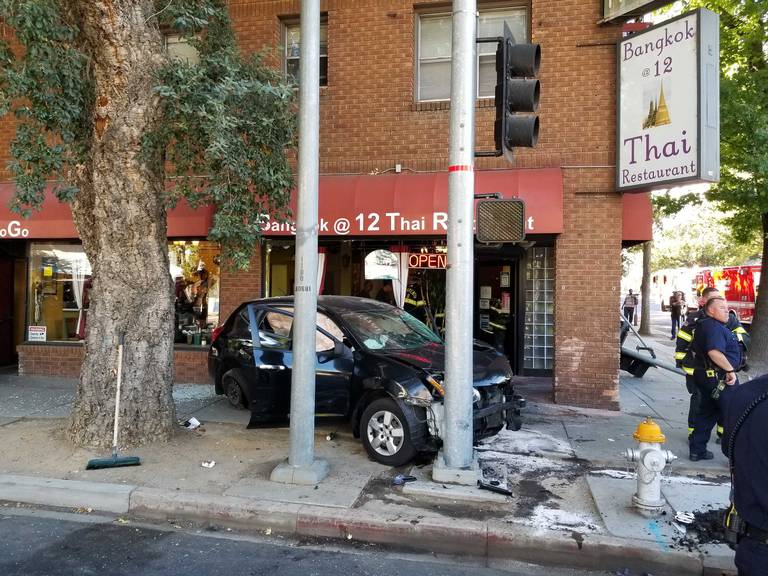
The city has installed substantial bollards on the southwest corner of I Street and 12th Street in an effort to protect the Bangkok@12 Thai Restaurant there.
There were at least two major injury crashes into the restaurant in 2019, and the location has a history of crashes (see https://www.sacbee.com/article235349392.html for one example). There were 26 collisions at this intersection in the five year period 2015-2019. This is the most for any intersection in the central city, with the next closest being 19th Street and X Street, at 17.
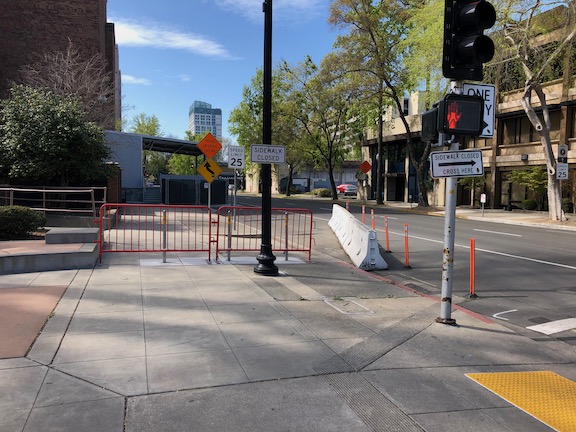
Why? Well, the primary reason is that this is the intersection of two 3-lane, one-way arterials, both of which are known to have a history of speeding. The city installed a speed display sign on 12th Street approaching I Street, but has not done so for I Street approaching 12th Street. I had not noticed this sign before yesterday, so I don’t know how long it has been there. Even a brief watch of it indicated that many drivers are exceeding the speed limit, some egregiously so, at more than 10 mph over the speed limit. And then, of course, there are the bollards pictured above. These are not solutions.

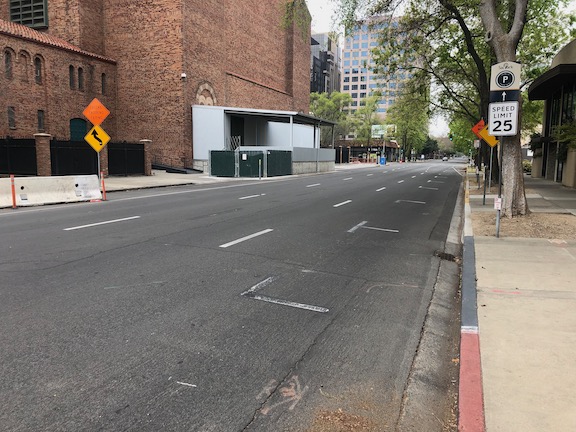
The city has identified the section of I Street east of 12th for a reduction in travel lanes from three to two, and that will help. But to the west, no reduction, so drivers will likely be speeding up through the intersection to spread out into the increased capacity. For 12th Street, a reduction from four (!) to three lanes will occur north of H Street, which may reduce speeds approaching here, but in the section between H Street and J Street, it will remain three lanes.
I strongly feel that all roadways of three or more lanes must be reduced to two lanes. Drivers simply cannot be trusted to behave properly on 3-lane roads. It doesn’t matter how much signing we add, or bollards we add, drivers will still speed and will endanger walkers, pedestrians, people in other vehicles, and people sitting down to eat a meal at restaurants.
Solution? The reduction in lanes on I Street must continue westward at least to 10th Street (I would continue it all the way to the freeway, but that is another issue). 12th Street must be reduced from three lanes to two lanes in the section between H Street and J Street (I would reduce it from C Street south). Most of the traffic on 12th Street turns left onto J Street, only a portion continuing south, so having one through lane and one left turn lane would not significantly reduce capacity, but would make things a great deal safer. A bonus would be that the left hand travel lane can be allocated to the exclusive use of the southbound light rail tracks. Currently, the southbound lane is shared between motor vehicles and light rail, and the light rail train is often delayed by congestion and by left turning vehicles. Two birds with one stone, as the saying goes.
The city’s Vision Zero effort focuses on corridors, stretches of street with a high crash rate, and this is not a bad focus, given that most of these corridors are in disadvantaged/disinvested communities. It does not focus on intersections, not even on very high crash rate intersections. San Francisco’s Vision Zero program, one of the leading in the country, identifies the top five corridors, AND the top five intersections. There has been significant though not necessarily complete infrastructure work on each of these. I would like to see the I Street and 12th Street intersection be prioritized for Sacramento.