Strong Towns strength test for Sacramento grid

The latest Strong Towns blog post is on the Strong Towns Strength Test. Ten simple questions. A Strong Town should be able to answer “yes” to each of these questions.

Here are my answers for the grid portion of Sacramento, downtown and midtown.

  1. Take a photo of your main street at midday. Does the picture show more people than cars? I picked J Street at 16th; others might pick other streets. No, more cars than people. However, there are a few intersections in downtown and midtown that probably have more people than cars, due to state workers walking to lunch.
  2. If there were a revolution in your town, would people instinctively know where to gather to participate? Probably yes, at Cesar Chavez Plaza, where Occupy Sacramento started.
  3. Imagine your favorite street in town didn’t exist. Could it be built today if the construction had to follow your local rules? My favorite street is actually an alley, Liestal Row, with Edible Pedal bike shop and Old Soul coffee. It has a woonerf-like design more welcoming to pedestrians and bicyclists than cars. Unfortunately, only one block long, and there aren’t any other alleys or streets like it. Yes, I think it could be built today. In general, developers can build what they want, but if it is outside the norm, it takes a long time and a lot of money.
  4. Is an owner of a single family home able to get permission to add a small rental unit onto their property without any real hassle? Not easily, and often not at all.
  5. If your largest employer left town, are you confident the city would survive? In Sacramento County (much larger than midtown/downtown, but I could not find city data), the largest employer is the state (Sacramento is the state capital), followed by the county itself, then health care organizations in 3rd, 4th, 6th and 7th, followed by three school districts, and then the city itself. The largest private employer is Intel at 5th. Except for Intel, none of these are leaving town, though some or all could shrink. I don’t know what the statistics are for midtown/downtown, but since the state capitol and most government buildings are in downtown, the state would be even more prominent. One of the blog post commenters suggested that the measure should be largest industry rather than largest employer. I would answer yes, just because so many employers would not leave that a private employer would not make that much difference.
  6. Is it safe for children to walk or bike to school and many of their other activities without adult supervision? Moderately safe, so yes. Since Sacramento City School District eliminated most of the neighborhood schools, children are now largely bused or delivered to school in parent’s cars. So a question I’d add is, are there neighborhood schools?
  7. Are there neighborhoods where three generations of a family could reasonably find a place to live, all within walking distance of each other? Yes, in midtown, no in downtown, so somewhat.
  8. If you wanted to eat only locally-produced food for a month, could you? Yes, if you define local as including Capay Valley and the foothill farms and ranches.
  9. Before building or accepting new infrastructure, does the local government clearly identify how future generations will afford to maintain it? No. I’ve never heard the government even raise the issue.
  10. Does the city government spend no more than 10% of its locally-generated revenue on debt service? The city budget of $873 million indicates that 10.8% is for debt service. However, the city has $2.1 billion in unfunded long-term debt (before the arena and any of the proposed civic projects), so if the city were actually paying down debt rather than accumulating it, the percentage would be higher than this. So, no.

Score on these ten questions = four no, one somewhat, and five yes.

Read More »

News summary November 16

Carnage

Other

News summary November 23

Carnage
Note: It is often not clear in these news reports whether the incident has anything to do with the mode of travel, of if any of the fault lies with the victim. Investigations take months, and the results are rarely reported in the media. So, sometimes I pass these items along, and sometimes I don’t.

Other

At the other end of the bike lane

bike-lane-symbol-farI have long wondered why so many people ride the wrong way in bike lanes. The common label for these bicyclists is “salmon,” probably from Portland, signifying they are swimming upstream against the current. Good for spawning salmon (and bears), bad for bicyclists. There are some evident reasons for wrong-way riding:

  1. The completely wrong but common misunderstanding that bicyclists should ride facing traffic. The origin of this is the “walk facing traffic if there is no sidewalk” rule. It doesn’t apply to bikes, but when teaching bicyclist education to youth, I often hear them mention this as something their parents have taught them. In fact, riding the wrong way is the most common bicyclist-caused source of crashes, though these are usually injury crashes and not fatal crashes.
  2. One way streets make it difficult to get where you are going, so many people ride the wrong way to get where they are going. Understandable, but wrong.

I’ve recently come to realize, however, that the common bike lane design fails to discourage wrong-way riding by not marking the end of the bike lane with a direction. The beginning, departing an intersection, is marked with the bicycle symbol and arrow, but the end, approaching an intersection is not. So a person entering the bike lane does not immediately realize they are going the wrong way. Once they do realize it, I think they often just continue along their way rather than changing course to ride with traffic.

The solution? Mark bike lanes at both the beginning and end. That way a person going the wrong way immediately sees that they are going the wrong way.

What is the downside? There may be some confusion induced between the dashed line message, which is that this is a merge area for the regular lane and the bike lane, and the bike lane symbol, which seems to indicate that the exclusive bike lane continues. I don’t see this as a stopper, but it is an issue to be addressed. It is possible that a different variation of the pavement marking could be used, but another symbol is probably not what is needed.

News summary November 9

Carnage

Other

North 12th Street Complete Street Project

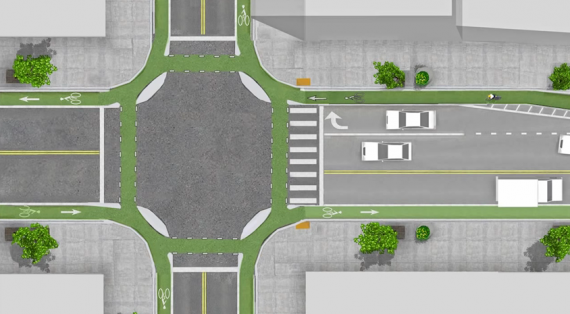
North12thSt-logoThe City of Sacramento is soliciting input on the North 12th Street Complete Street Project, the most significant portion of which would install a two-way cycletrack on the west side of 12th Street between the Hwy 160 bridge over the American River near Richards Blvd, and as far south as F Street.

The project should be compatible with and benefit from the Choice Neighborhoods Initiative Twin Rivers project which would revitalize the Twin Rivers Community Housing and the surrounding area. The January 2014 Final Transformation Plan is available from SHRA.  Though the plan does not go into great detail on streets and transportation, page 78 does provide a good overview of the changes and the relationship to 12th Street and other efforts in the River District and Railyards. In particular:

  • Richards Blvd would be realigned and extended east of 12th St
  • several streets intersecting 12th St would be reconfigured, particularly Bannon St
  • a potential SacRT light rail station near the redevelopment and Richards Blvd

There is also a City of Sacramento project to add sidewalks to the east side of 12th St between B St and Richards Blvd.

Read More »

News summary November 2


Junk statistics and junk reporting

The Governor’s Highway Safety Association issued a report titled Bicycle Safety. The report is full of junk statistics, and the Los Angeles Times reported on the report with junk reporting. SABA and other advocacy organizations reposted on Facebook. It would take many posts or many paragraphs to respond to this junk, but here are a few points.

  1. Reporting bicyclist fatality COUNTS for different states is pointless and irresponsible. Yes, California has more fatalities. It also has more people. This is like comparing some statistic from Lichtenstein with the same from China. Nonsense! If a number is reported at all, it should at least be a number per 100,000 population. But the report author know that would be much less sensational, so doesn’t. Junk statistics.
  2. The report states “Adequate exposure data are not available to accurately monitor changes in bicycle travel…” and then goes on to draw all sorts of conclusions. The right way to report any crash statistic is as a rate, such as how many people were killed per mile traveled on bicycle (and in different settings that would distinguish recreational riding from commuting and errands). Unfortunately Caltrans and other states transportation agencies steadfastly refuse to gather bicycle use data, and the Governor’s Highway Safety Association should know this as well as anyone. Junk statistics.
  3. The report states “Lack of helmet use is a major contributing factor in fatalities.” But it provides absolutely no data to support this claim. Is there anything here to support the idea that these people would not have died if they were wearing a helmet? No. The other “research” cited is full of holes and assumptions leading to foregone conclusions. The report states that helmet requirements in Canada and Australia are examples of success, increasing helmet use and decreasing fatalities. In fact, there is plenty of initial data to indicate that these laws decreased use and increased the fatality rate per 100,000 people. Fewer people biking means a higher risk per person. Junk statistics, again.
  4. The LA Times articles opens with a photo of a crash test dummy flying through the air. Worthy of Fox News, for sure, but the LA Times? Blood leads. Junk reporting.
  5. The report and the Times article lists several solutions that have to do with separated facilities. But it makes the common leap of faith, prevalent among some in the advocacy community, that a preference among many bicyclists for separated facilities (which is certainly true) would lead to a decrease in fatalities. Do we know that? No. There has been some research to indicate that is true, but the same research has also been widely criticized. The truth is that we don’t know yet. I’m not suggesting that we not discuss the benefits of separated facilities, but to a priori claim that separated facilities are the solution to bicyclist fatalities is nonsense.

Junk statistics. Junk reporting. Junk. Junk. Junk. Don’t get sucked into this nonsense.

Yes, we should actively and intelligently seek answers to both the causes and solutions to bicyclist fatalities. Unfortunately, neither this report nor the LA Times article adds anything of value.

News summary October 26

Carnage

Other