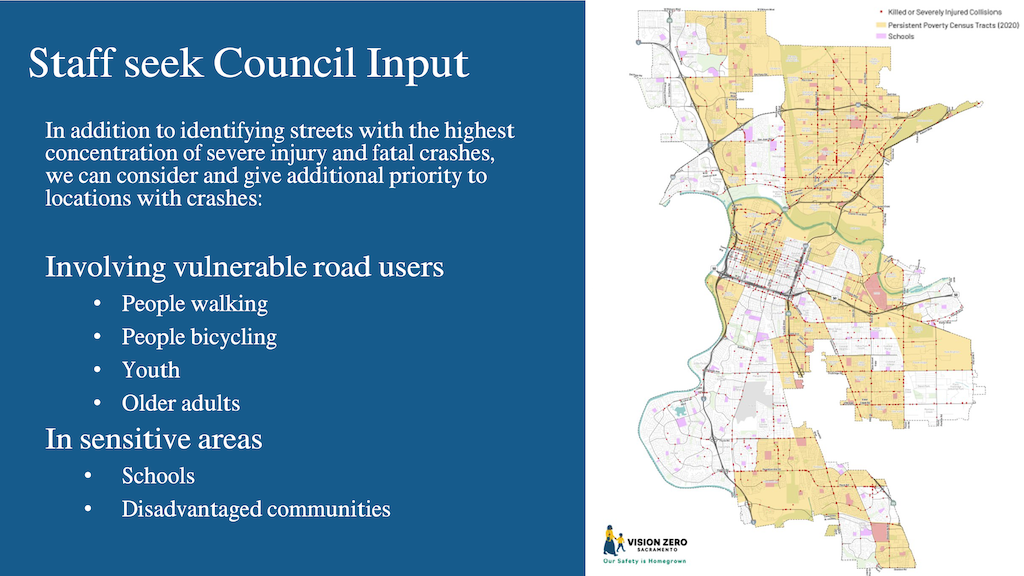
In an earlier post on City Council discussion of the Vision Zero Action Plan update, which happened on March 17, I did not identify which if any of the vulnerable users and locations of concern I would support, but implied that the criteria should simply be the incidents of fatality and serious injury.
I’ve been reflecting on this over the last week, and have spent time in a disadvantaged, low-income community in Del Paso Heights, and some moderate to high income communities in other parts of Sacramento, as well as several other cities in Northern California. As a result I am not going to clearly say that I think the primary, not only, criteria should be disadvantaged communities, which is item 6 on the list, under ‘in sensitive areas’.
Use of the term ‘disadvantaged communities’ doesn’t really get at the issue. The term implies that there is something innate to these places that causes them to be naturally disadvantaged, and even more insidious, that the people there have made themselves disadvantaged. I’m not saying this is the prevalent attitude, but I have certainly heard if from many people.
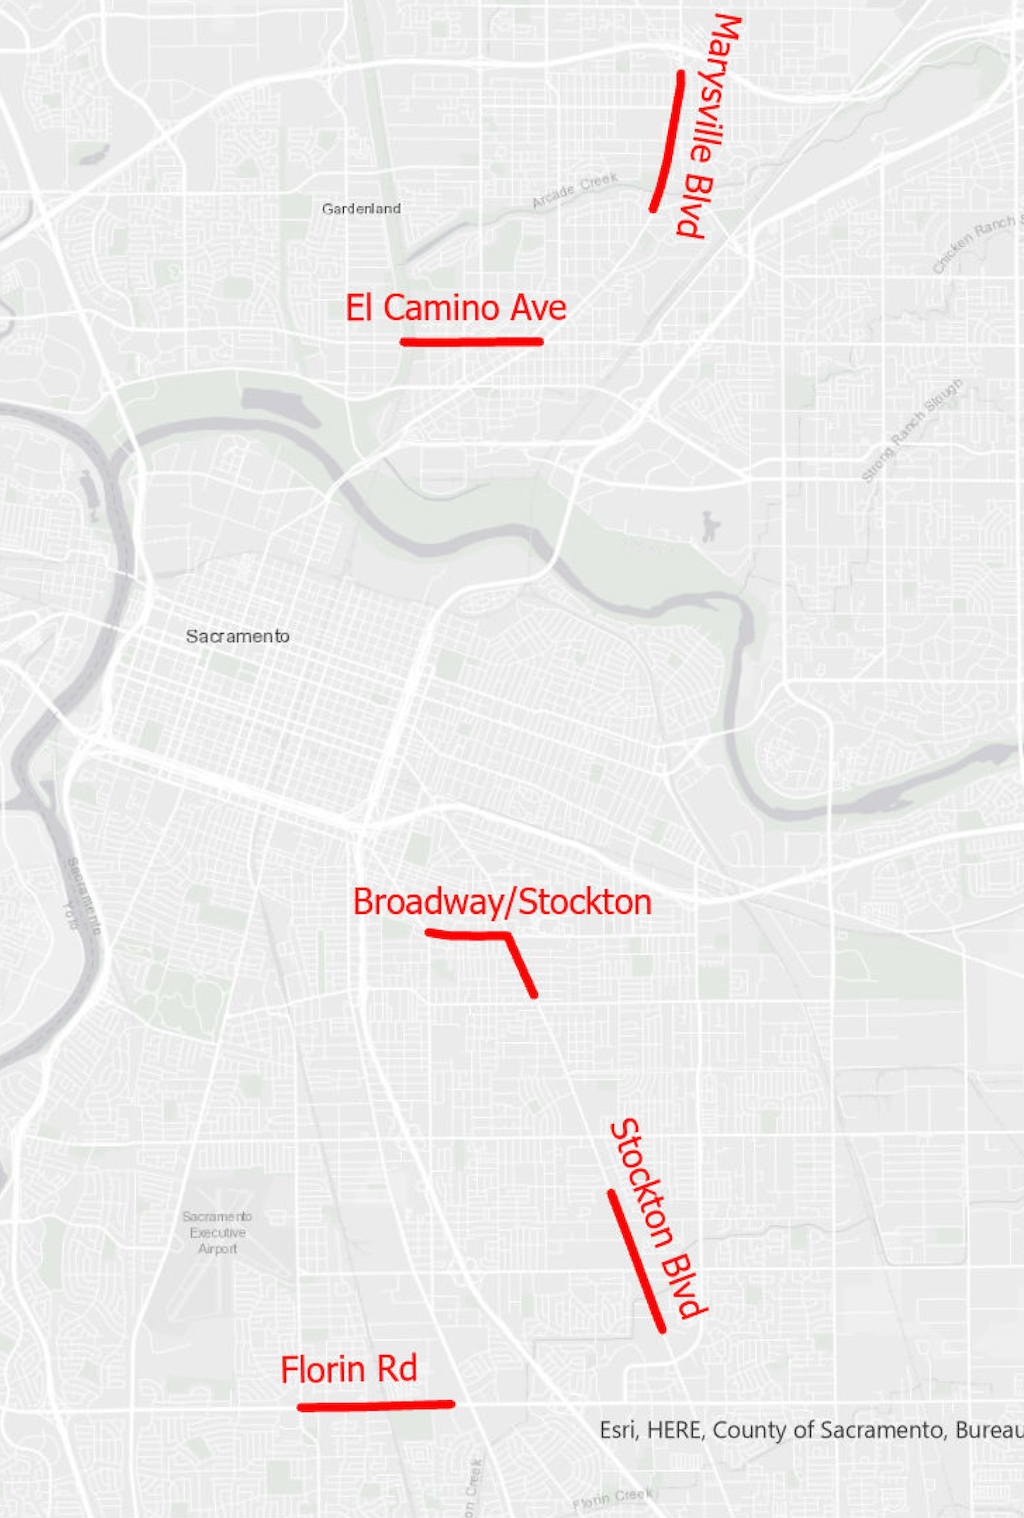
However, I think the more accurate term is ‘disinvested communities”. The City of Sacramento has, over many years, spent significantly less money in the low-income and high-minority communities of south Sacramento and north Sacramento, which includes Del Paso Heights. The city has allowed public resources, including but not limited to roadways, to deteriorate. Instead, the city has widened roadways from neighborhood streets to wide arterials, for the benefit of higher-income and whiter commuters passing through. These wide streets are where the highest crash rates are, and where people do not feel safe walking and bicycling, or even in their cars. The neighborhoods suffer from higher air pollution levels attributable to these wide roads, and the concentration of pollution-generating land uses. These neighborhood are now host to abandoned and deteriorated building, and empty lots where there used to be buildings – homes and businesses. The city shrugged its shoulders and allowed this to happen, rather than investing in these places. The city has expressed concern about this decline, and made plans to mitigate it, but has done almost nothing. And it shows.
So, yes to the ‘disadvantaged communities’ focus area. Yes to undoing at least some of the damage of past disinvestment.