Walk Score offers an assessment of the walkability of any location. It is available in any browser at https://www.redfin.com/how-walk-score-works. The Redfin app shows walk score, bike score and transit score for each listing (scroll way down). Walk Score is based on the distance to the places people want to go, such as grocery stores, restaurants, coffee shops, bars, movie theaters, schools, parks, libraries, bookstores, fitness locations, drug stores, hardware stores, and clothing & music.
WalkScore has released for Sacramento a new walk score, 43, transit score, 33, and bike score, 68. New York is the top walk score city at 92, followed by San Francisco, Boston, Philadelphia and Miami. New York is the top transit score city at 81, followed by Boston, San Francisco, Washington DC, and Philadelphia. Portland is the top bike score city at 70, followed by San Francisco, Denver, Philadelphia and Boston. Sacramento compares very well in bike score, at 68, but poorly in walk score and transit score.
For the Sacramento region, walk scores in various neighborhoods range from 5 to 92 (of 100), transit scores range from 11 to 65, and bike scores range from 38 to 100. In general, the scores track with each other, walk friendly = transit friendly = bike friendly, however, there are exceptions. You can look up your neighborhood on the chart linked below, or go to WalkScore for a lot more detail on Sacramento. The top five neighborhoods are Boulevard Park, Downtown, Midtown/Winn Park/Capital Avenue, Marshall School and Mansions Flats, all in the city of Sacramento. WalkScore exists largely as a sales tool for houses and apartments, but it has broad applicability as well.
I can be an incredible cynic sometimes, but here goes another one. Particularly true of drivers in the suburbs, and of suburban drivers in the urban areas, but more widespread than just that.
There is a bill before Congress to restore the parity between parking tax breaks and transit tax breaks. Most of the media, unions and environmental organizations are arguing to achieve parity in the tax subsidy, by raising the transit benefit to that of the parking benefit. Some have questioned whether it might not be better to reduce the parking benefit to that of the transit benefit (Level the Commuter Playing Field By Reducing the Tax Break for Parking, Streetsblog DC 2014-01-02). I’ll argue that there should be no tax benefit whatsoever for parking. As Shoup says, there is no such thing as free parking. Any parking subsidy at all encourages drivers to make poor economic choices, which means in this case that they are more likely to drive to work than they otherwise would be. Ultimately, there shouldn’t be any direct tax benefit for any modes of transportation, not even bicycles. We can better express societal priorities by rational expenditure decisions than by subsidies. In the short term, however, it might make sense to continue transit (and bicycling) subsidies in order to make up for the past perturbations that we forced into the system with parking subsidies.
We should be arguing for the complete elimination of the parking tax benefit. Period.
When people, and their employers, come closer to paying the real costs of parking, we will have less parking and fewer people commuting by motor vehicle. That is a benefit that doesn’t require a tax subsidy.
“Not all economic development is created equal. Not all local investments build wealth in our community. Not all open markets produce optimal outcomes for all places. If we want our places to prosper over time, we have to be prepared to ask a tougher set of questions at the local level.” Charles Marohn, in Dunkin Our Future, on Strong Towns blog
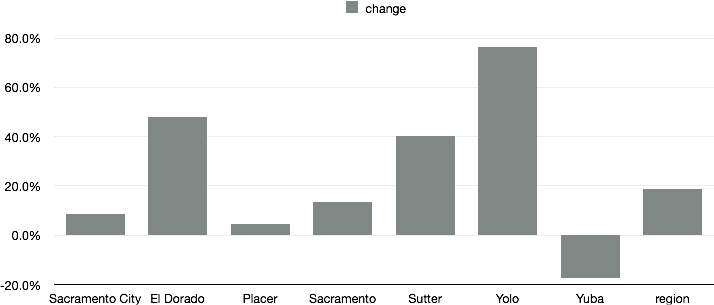
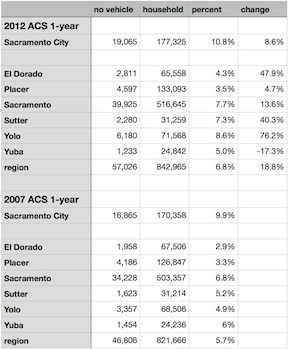
I read with interest the Streetsblog DC post “The American Cities With the Most Growth in Car-Free Households” and wondered about Sacramento. I dove into the American Community Survey, using the same 2012 ACS 1-year and 2007 ACS 1-year data that the research had used to look at the number of car-free households in other cities. Over the period when the national average increased from 8.7 percent share of households without a vehicle to 9.2, the six-county Sacramento region increased from 5.7 to 6.8. Not very impressive, but the change or delta was an impressive 18.8%. Yolo County, probably Davis, led this change with a remarkable 76.2% increase!
Below is the chart of change from 2007 to 2012, for the City of Sacramento, El Dorado, Placer, Sacramento, Sutter, Yolo and Yuba counties, and the region, which is an average of those six counties. Following the chart are the numbers I retrieved from ACS. If you would like to look for yourself, go to the ACS Advanced Search, and then under Topics select Housing > Occupancy Characteristics > Vehicles Available.
In the blog post, the largest major city increase was Detroit at 5%, and our neighbor San Francisco was sixth at 1.9%.
I’m not quite sure what to make of these numbers. Is there a flaw in my logic? I had to impute the no vehicle households from the total households and percentages for 2007, because the actual number doesn’t seem to be available in the data tables. Were the numbers so small in 2007 that such large changes don’t really mean much? I don’t know. Your thoughts?
Viewpoints: Modernize California’s freight transportation system to cut pollution (SacBee 2014-01-19); the viewpoint mentions shifting freight from trucks to rail, however, this is the most important thing we could do to reduce pollution and energy consumption, but we won’t ever get there unless we stop subsidizing trucks over rail