Measure A, the transportation sales tax for Sacramento County, failed spectacularly, 44% yes and 55% no. Advocates for a better, safer, more equitable transportation, and better investment of our transportation dollars, celebrate this failure. Final election results were released on December 8, 2022.

More analysis of the results and significance to come, but for now, some maps.
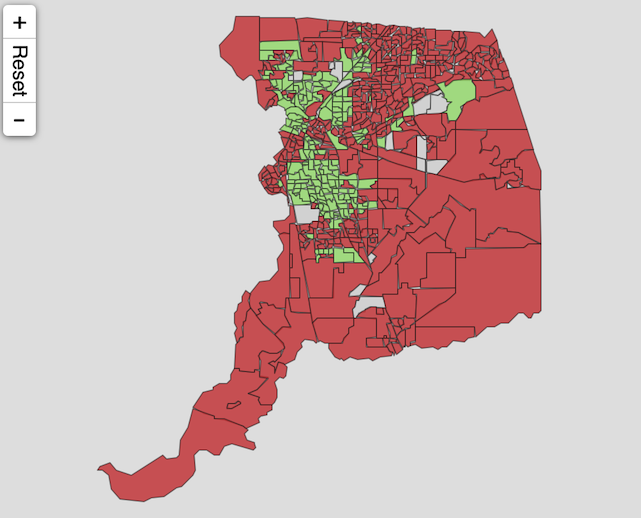
Sacramento County Elections provided a map of the Measure A results.
Sacramento Bee provided a similar though not identical map.
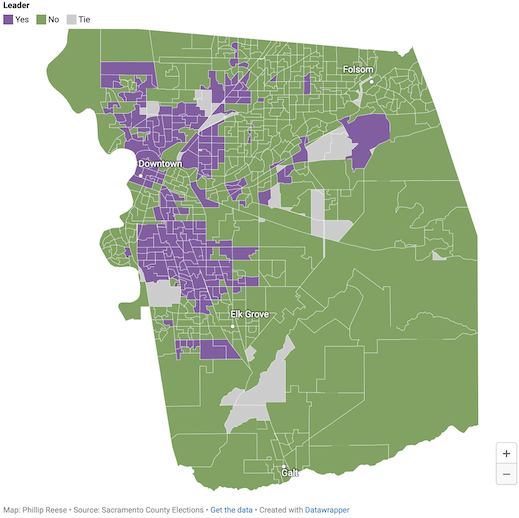
Both these maps indicate whether a precinct voted yes or no, but no indication of the number of voters or the proportion of the vote yes or no. There is a movement towards better election reporting maps, called ‘Land Doesn’t Vote, People Vote’. A few references are U.S. election maps are wildly misleading, so this designer fixed them, Election graphics 2020: Land (still) doesn’t vote, and Land Doesn’t Vote, People Do: This Electoral Map Tells the Real Story, but you can find many more.
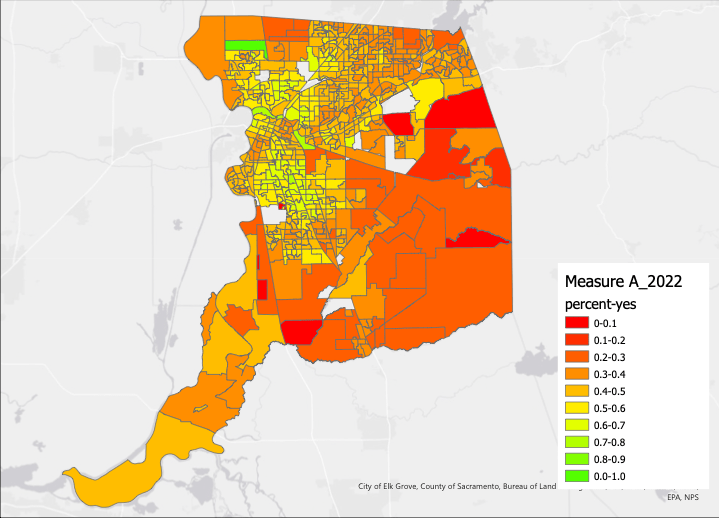
Below is my first attempt at producing a better map for Measure A. Click on the graphic for a linked pdf, which allows you to zoom in on specific areas. What’s different? I used a range of colors, from red (no) to green (yes) votes (ArcGIS: graduated colors, equal interval, 10 classes). You can see there is much more subtle detail. There were a few precincts which voted entirely no or entirely yes, but very few. Most were somewhere in between. For elections (other than the antique federal electoral college), votes count, precincts do not.
The map still over-emphasizes precincts with large area and few voters (some precincts have as few as one person who actually voted). If you look (unfocus your eyes), you would think that there were almost no ‘yes’ votes in the county, but that is not accurate.
The data I used, modified from the Sacramento County Elections data, is here.
Some of the other map alternatives, which are better, require ArcGIS techniques and skills that I’m just looking into, so I expect I’ll have better maps soon. Stay tuned!

[…] For a map of election results by precinct, see Measure A fails, and mapping. […]
LikeLike
Interesting where the support is showing up in your maps – not where I would have thought it would come from. Hopefully for future transit and active transportation initiatives we can make more headway in the North and South Sac areas that could benefit so much!
LikeLike
[…] is a follow-on to the post Measure A fails, and mapping. with a map focusing on just the City of Sacramento […]
LikeLike