Secretary of Transportation Anthony Foxx challenged the nation’s mayors to reduce pedestrian and bicyclist fatalities and injuries on his Fast Lane blog and detail. The challenge has been repeated many places, including Streetsblog USA. Though I’m happy that the secretary is bringing attention to the issue of rising pedestrian and bicyclist fatalities (while motor vehicle driver fatalities are declining), I have to see this campaign as disingenuous. Of his seven challenge activities, not one of them mentions funding. Yet a significant contribution to pedestrian and bicyclist fatalities and injuries is that we continue to spend transportation dollars on motor vehicles and not on pedestrians and bicyclists. Though pedestrian and bicyclist fatalities are now 17.3% of the total, we spend only about 2% of our transportation funds on protecting pedestrians and bicyclists.
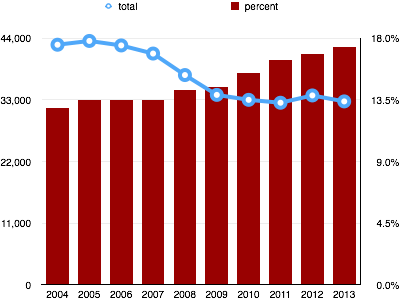 Foxx says “Unfortunately, in the five years from 2009 to 2013, bicyclist deaths were up 15 percent and pedestrian deaths are up 16 percent. In 2013, more than 5,000 pedestrians and bicyclists were killed, and more than 100,000 were injured.” More significant is that pedestrian and bicyclist fatalities are have continued to be an increasing portion of total fatalities. In the chart at right, the blue trend line, of total fatalities is clearly down, and NHTSA (National Highway Traffic Safety Commission) and others have tooted this horn at every chance. What they rarely talk about, and in fact try to hide in their reports, is the other trend, shown by the red bars, that the percentage of fatalities for pedestrians and bicyclists has continually climbed. These are not two unrelated trends. We have spent tremendous amounts of transportation money, and imposed increasing requirements on car manufacturers, in order to reduce the fatality and injury rate of motor vehicle drivers. But this reduction has led to an increase in pedestrian and bicyclist rates. They are inversely correlated to a remarkable degree. This data in the chart is from the NHTSA Fatality Analysis and Reporting System (FARS).
If Foxx were serious in his commitment to pedestrian and bicyclist safety, he would do everything in his power (considerable but not complete) to shift transportation funding to the protection of pedestrians and bicyclists, and would be before Congress daily supporting this change (for the portions he cannot control).
So, here is Dan’s challenge to Secretary Foxx: Take pedestrian and bicyclist fatalities seriously by immediately shifting the federal portion of transportation funds to match the fatality rate of 17.3%.

