Other posts on the City of Sacramento Vision Zero Action Plan update are available at category: Vision Zero.
The 2018 Vision Zero Action Plan focused entirely on corridors. It did not identify high injury intersections, nor suggest actions at those intersections, unless they were also part of a high injury corridor.
The update does recognize that intersections should be addressed, but at least so far doesn’t focus on them. It should. Element 6 says “Continue developing designs and securing grant funding for the Top 10 priority corridors identified in the 2018 Action Plan, with a focus on roadway designs for reduced speeds and in Areas of Persistent Poverty” which is fairly specific. Element 7 says
“Complete 10 projects that separate severe vehicle-vehicle conflicts as well as vehicle-people or vehicle-bike conflicts at intersections” which is rather vague.
Why are intersections important? Because that is where most of the fatalities occur. Fatality locations are not, and should not, be the only criteria for focus. Serious injuries are also important, and the pattern of these is both more dense and different from fatalities. Actions that prevent fatalities or serious injuries are important.
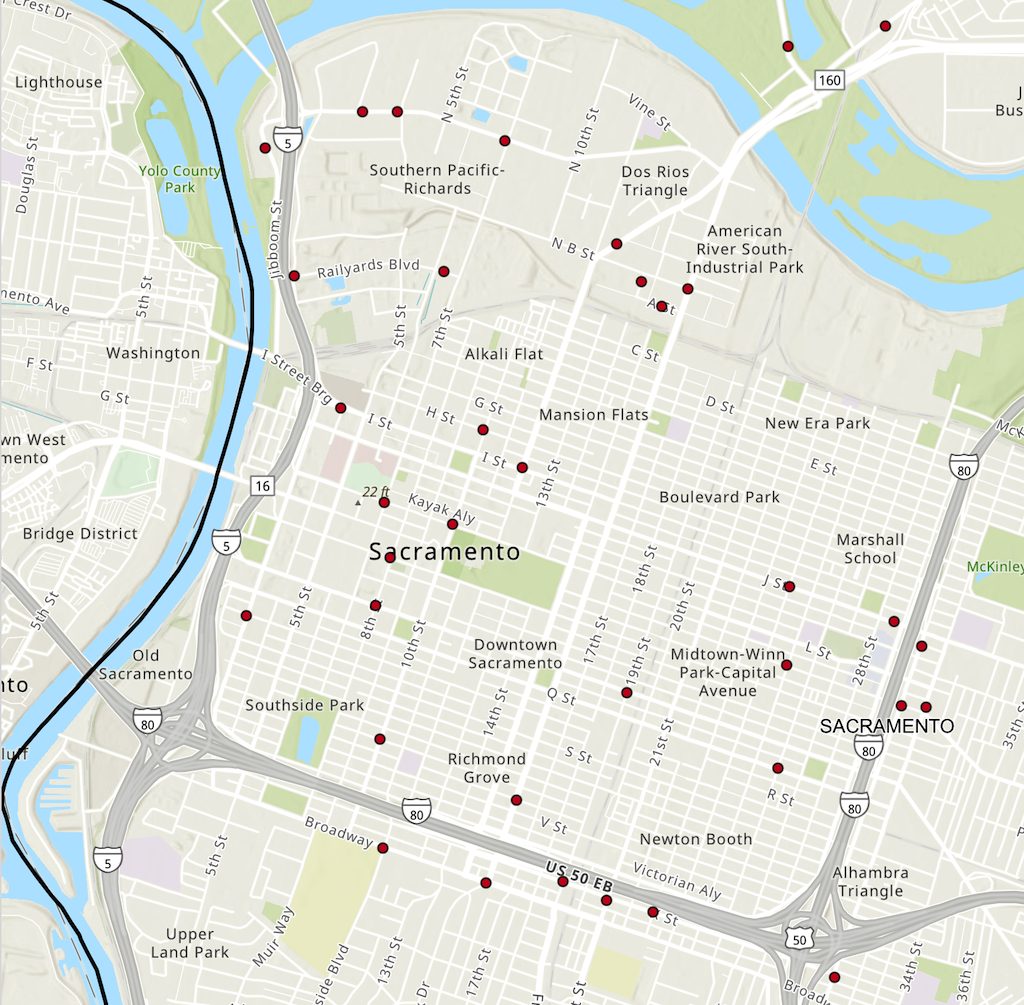
The map below, an except from the Vision Zero Crash Dashboard Interactive Map, shows only fatalities in the central city (American River to Broadway, Sacramento River to Alhambra). Of the 34 fatal crash locations shown, it appears that five are not at intersections, therefore 29 are at intersections.
This is a visual screen based on the map location of the crashes. The map shows primary road and secondary road for every crash, but does not show distance from the intersection. It would take an analysis of ever crash location to determine for certain whether it is at, near, or away from an intersection.
The only pattern that might be considered a corridor is X Street, the roadway just south of Hwy 50, known to be a high-speed traffic sewer.
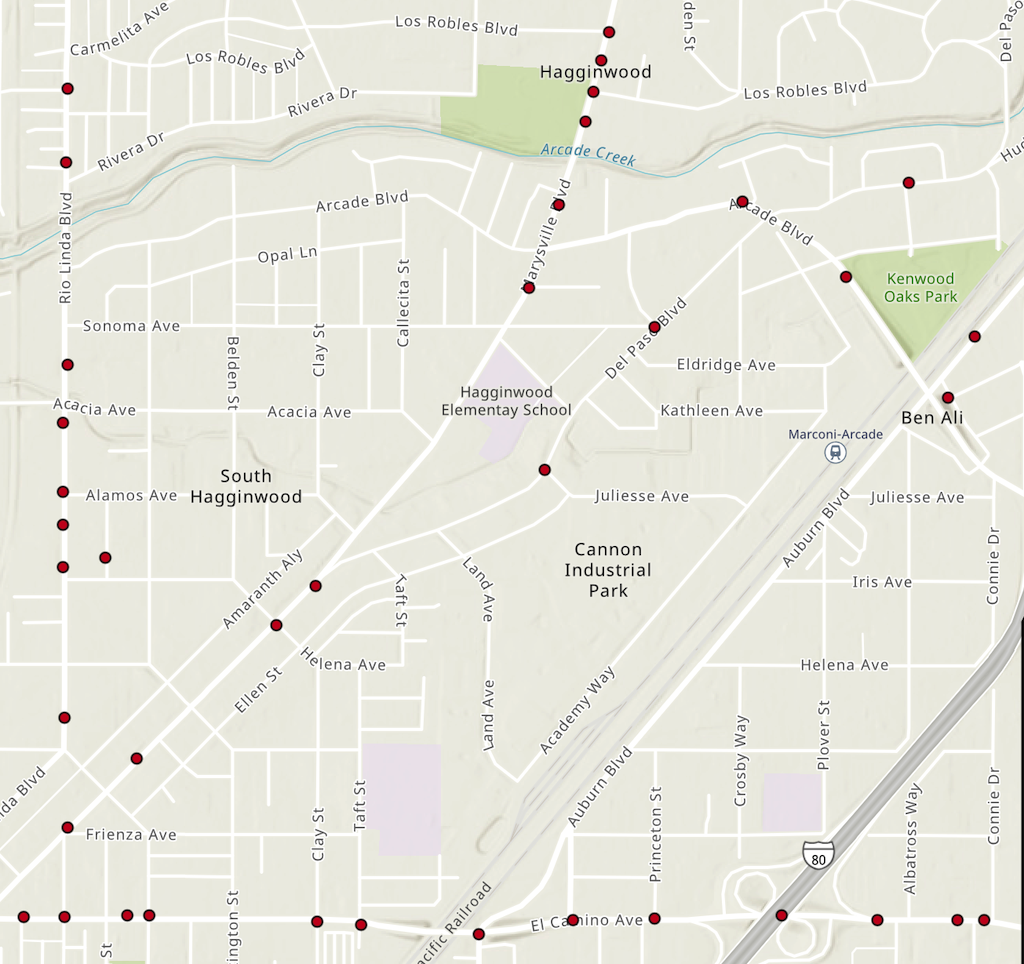
The next maps shows 39 crashes in an area of northeast Sacramento. Of the 39, it appears that 15 are not at intersections, therefore 24 are at or very near intersections.
This is a visual screen based on the map location of the crashes. The map shows primary road and secondary road for every crash, but does not show distance from the intersection. It would take an analysis of ever crash location to determine for certain whether it is at, near, or away from an intersection.
A corridor pattern is more evident on this map. Both El Camino Ave (at the bottom) and Marysville Blvd (middle north) have been identified as high injury corridors.
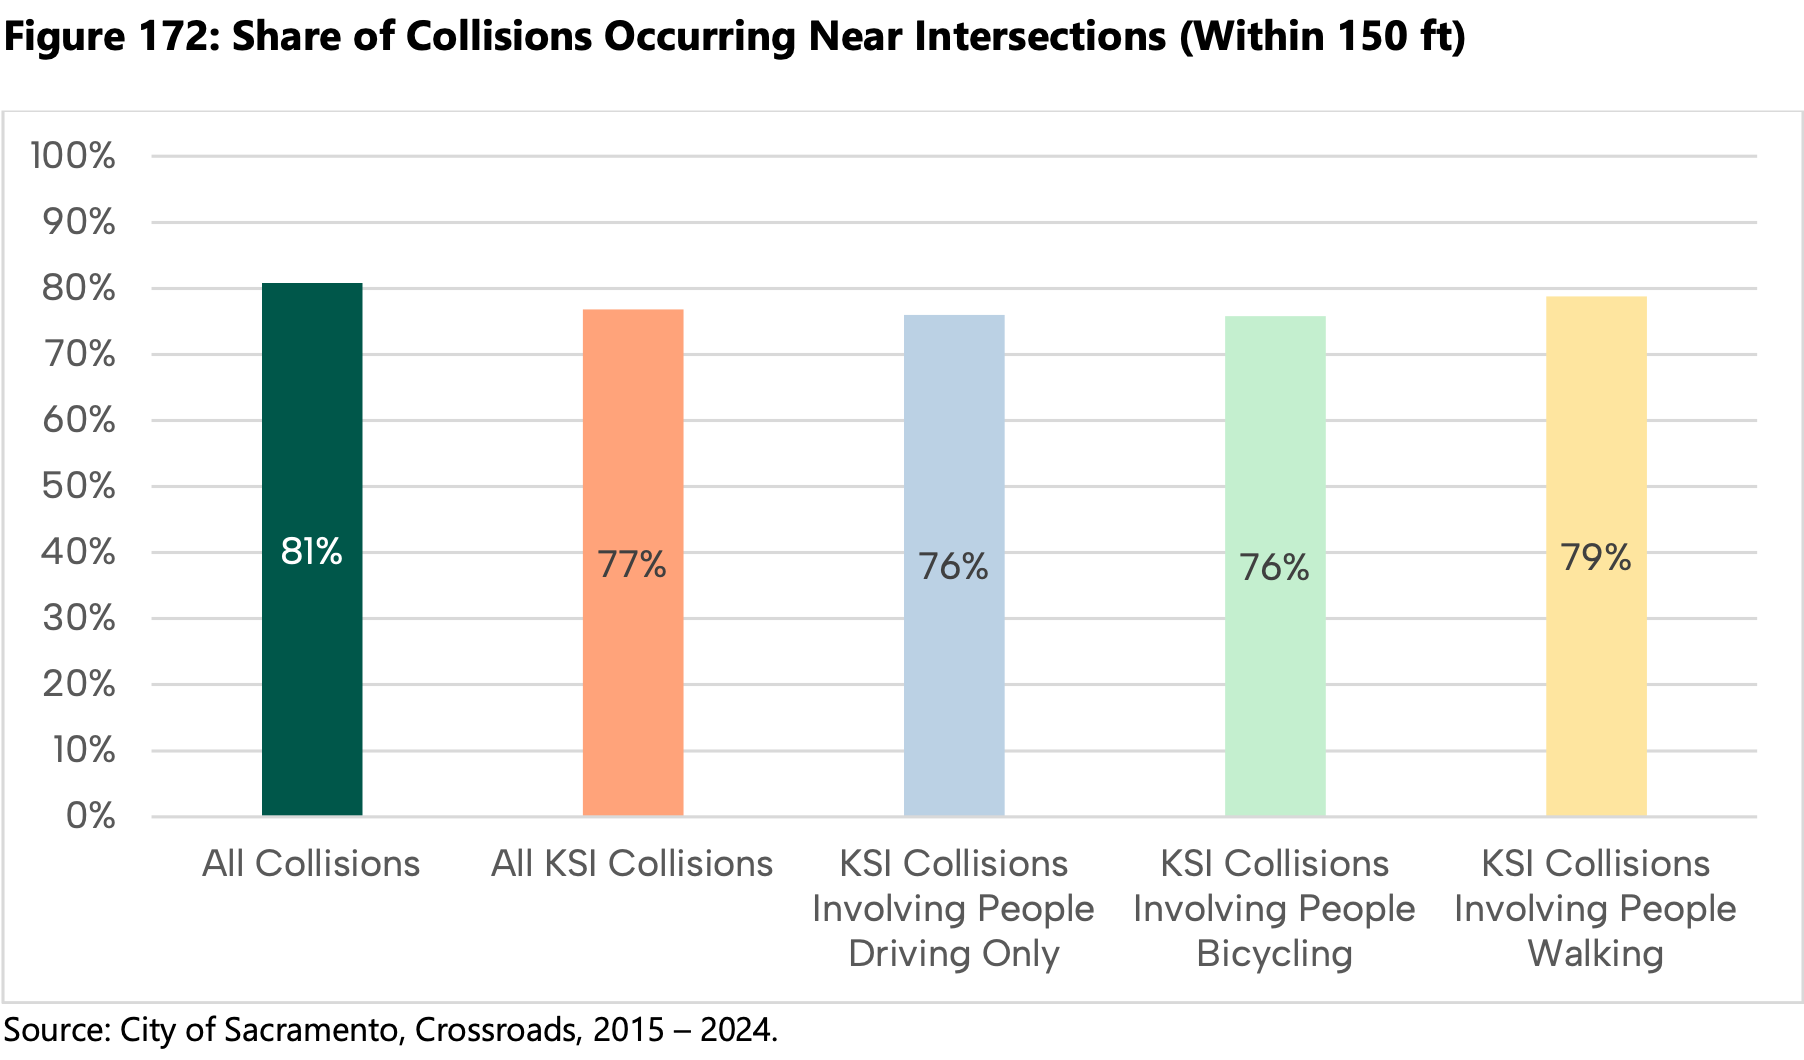
Confirming the intersection dominant pattern, the chart below is from the Collision Landscape Summary and Collision Profiles memo.
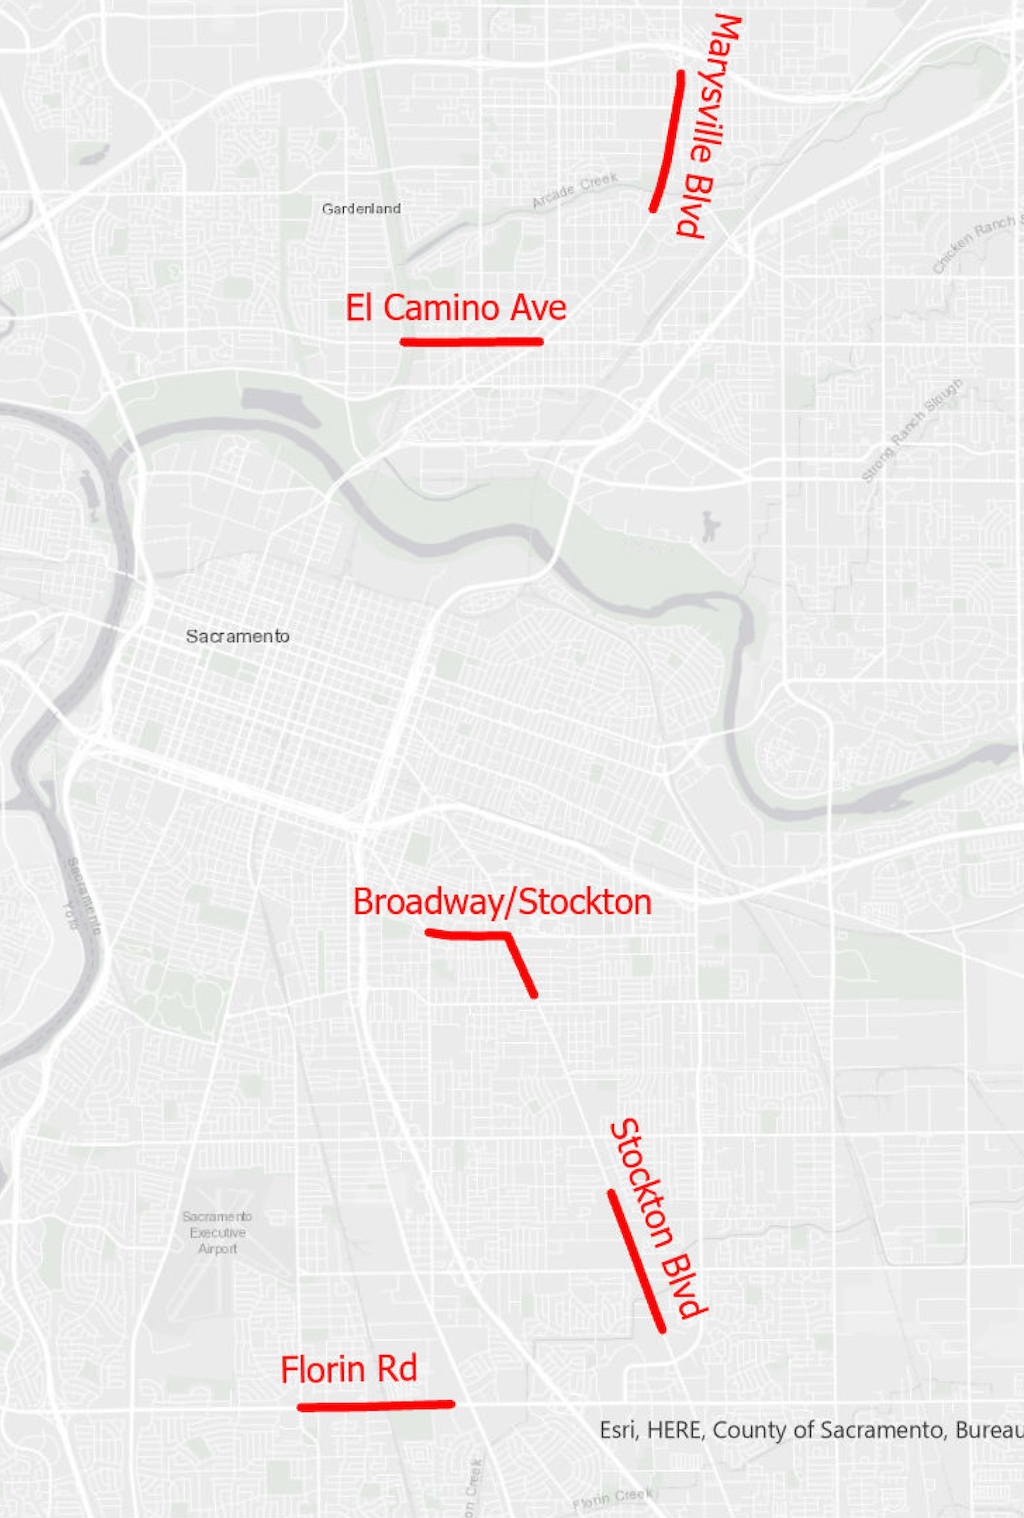
The map below shows the Vision Zero Top 5 Corridors from the 2018 Action Plan.

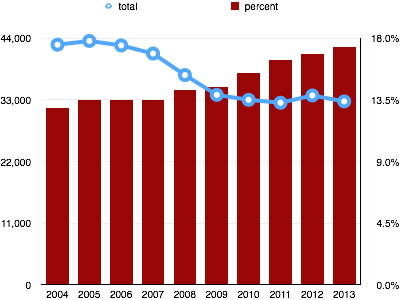 Foxx says “Unfortunately, in the five years from 2009 to 2013, bicyclist deaths were up 15 percent and pedestrian deaths are up 16 percent. In 2013, more than 5,000 pedestrians and bicyclists were killed, and more than 100,000 were injured.” More significant is that pedestrian and bicyclist fatalities are have continued to be an increasing portion of total fatalities. In the chart at right, the blue trend line, of total fatalities is clearly down, and NHTSA (National Highway Traffic Safety Commission) and others have tooted this horn at every chance. What they rarely talk about, and in fact try to hide in their reports, is the other trend, shown by the red bars, that the percentage of fatalities for pedestrians and bicyclists has continually climbed. These are not two unrelated trends. We have spent tremendous amounts of transportation money, and imposed increasing requirements on car manufacturers, in order to reduce the fatality and injury rate of motor vehicle drivers. But this reduction has led to an increase in pedestrian and bicyclist rates. They are inversely correlated to a remarkable degree. This data in the chart is from the
