housing plus transportation affordable

I have mentioned the concept of H+T, housing plus transportation, in previous posts, but not focused on it. H+T is a concept developed by Congress for a New Urbanism’s Center for Neighborhood Technology. The Affordability Index concept is explained as:

“The H+T® Index provides a more complete measure of affordability.

By taking into account the cost of housing as well as the cost of transportation, H+T provides a more comprehensive understanding of the affordability of place.

Dividing these costs by the representative income illustrates the cost burden of housing and transportation expenses placed on a typical household.

While housing alone is traditionally deemed affordable when consuming no more than 30% of income, the H+T Index incorporates transportation costs—usually a household’s second-largest expense—to show that location-efficient places can be more livable and affordable.”

The traditional way of finding ‘affordable’ housing, for those able to, is to ‘drive until you qualify’. The further away from the core city, the less expensive housing becomes, because the cost of land is lower, and the level of subsidy for development is higher. Of course there are exceptions – think Granite Bay, the most expensive and highest income area in the region. But with lower housing costs come higher transportation costs. In fact, it is almost an inverse relationship. The longer travel distances and the lack of choice of modes – driving becomes the only choice – eat up savings from less expensive housing.

For Sacramento County, the map of H+T is below. The fact sheet for Sacramento County is here. In general, the affordable areas (light color) are downtown, Stockton Blvd (with SacRT bus route 51), Interstate 80 east (with SacRT light rail Blue Line and bus route 1). Overall for the county, 52% of income is spent on housing plus transportation, with 29% being housing and 23% being transportation. That is a remarkably high transportation component. Why? Because Sacramento County is so spread our, vast areas of low density housing, and undeveloped land (that used to be agricultural land) that has been leapfrogged over by developers seeking even less expensive land to develop. If time allows, I will use the H+T data to overlay with the transit system and pin down better the relationship between transit and transportation costs. But for now, you can clearly see there is a relationship.

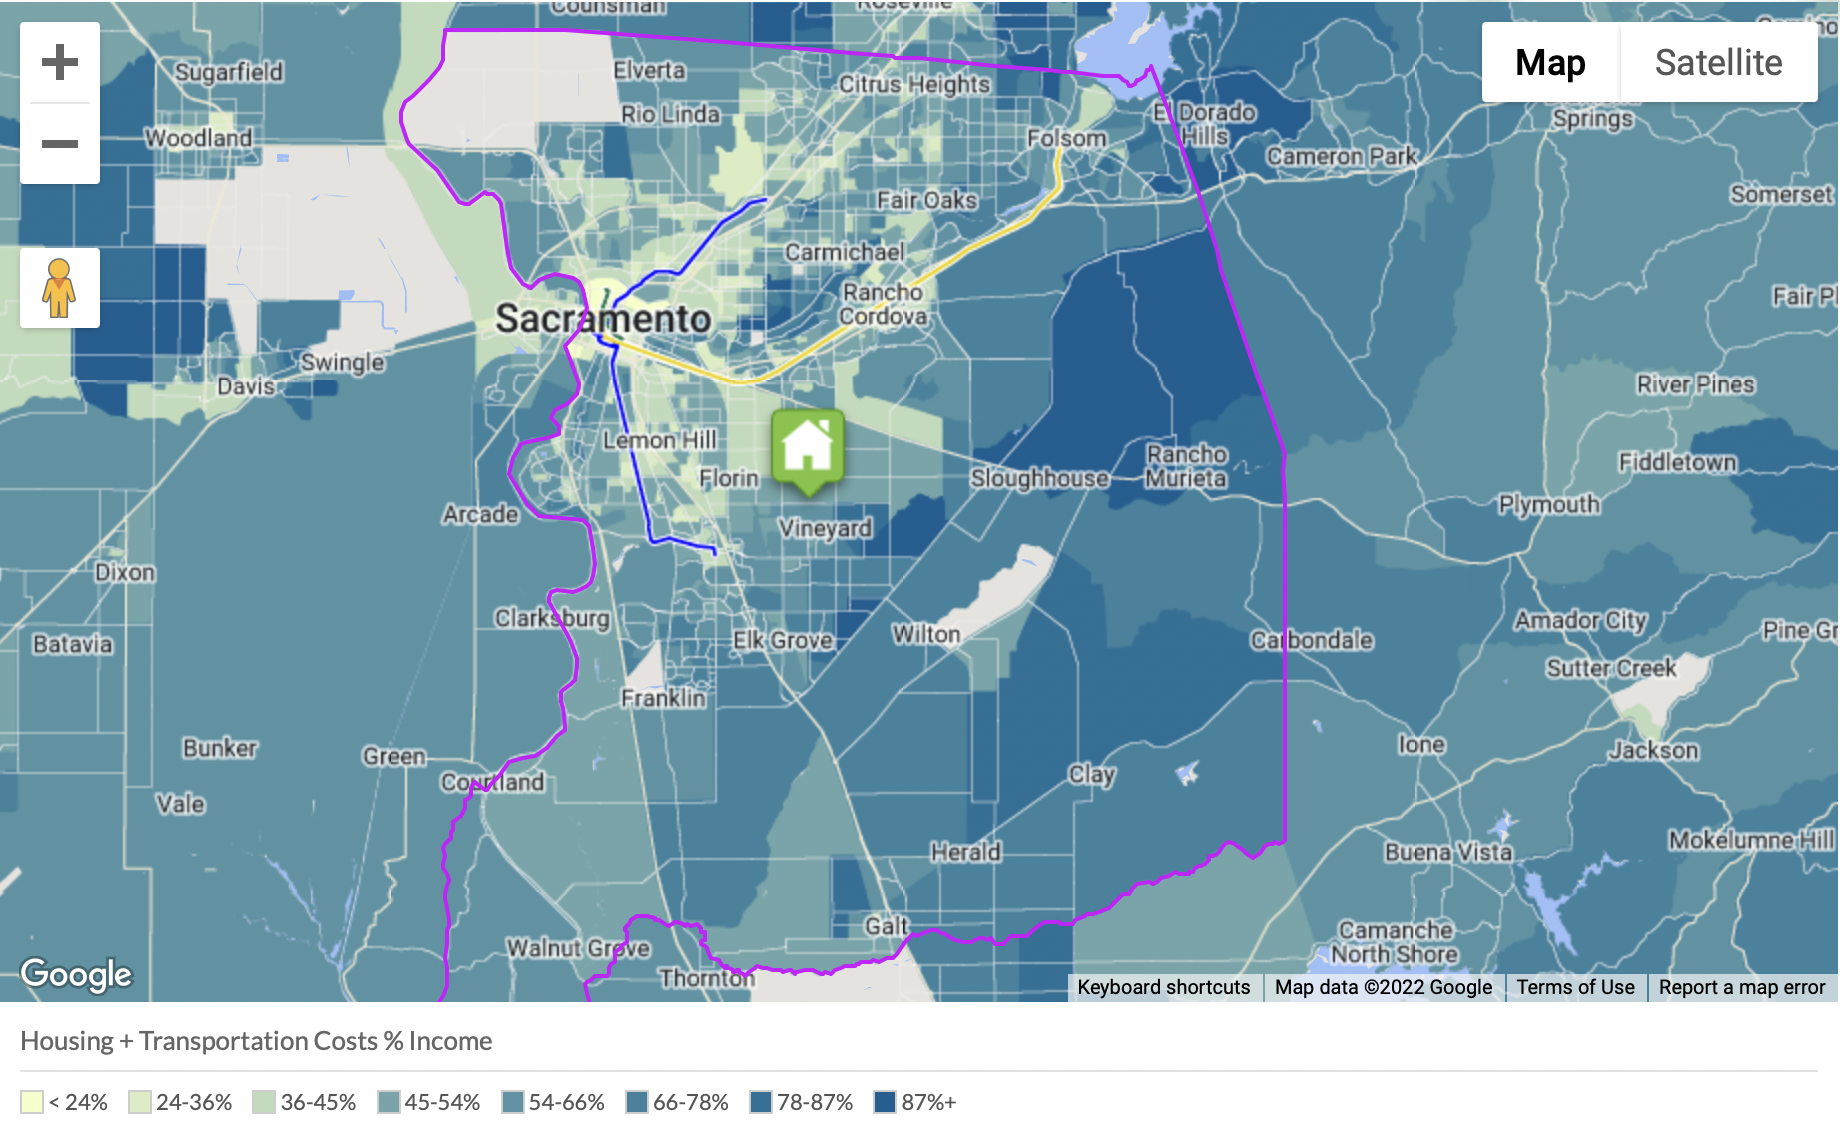
Why is H+T so important, at this point in time? Because the proposed transportation sales tax for Sacramento County, Measure A, focuses mostly on the old model of transportation, where freeways and arterials provide fast travel to far flung developments. The banner project in the measure is the Capital Southeast Connector, which comes nowhere close to the capital, in fact avoids the city of Sacramento and will provide no benefit to the city. See all the high transportation cost areas, the darker blue? The measure envisions more and more of those, places where the housing might be relatively affordable, but transportation costs are back-breaking. The measure wants to build more freeways and interchanges, expand freeways, widen roadways, and ease travel along major arterials. It is not interested in sidewalks and bicycle facilities that would support more housing in the already transportation affordable areas. The complete streets are all along major arterials, the dangerous, busy, noisy, pollution generating roadways that are not where affordable housing should be.

The measure provides some funding for transit, but significantly less than the existing Measure A, less than the 2016 Measure B which failed at the ballot box, less than the draft 2020 Measure which was withdrawn in part due to the pandemic. It also sees the function of transit as mitigating motor vehicle capacity expansion projects, not as a valid mode of travel.

Infill housing can be affordable, if priced correctly. Yes, under current housing cost inflation, almost nothing anywhere is affordable, but in concept infill can be affordable. Greenfield development can never be affordable because the transportation component of H+T will always be too high in greenfield areas.

Sacramento County and the cities in the county are obligated by state law, under the RHNA (regional housing needs assessment) process, to zone sufficient areas for housing at many income levels (very low, low, moderate, above moderate). The proposed measure, because it sucks up nearly all transportation funding into areas of moderate and above moderate housing, pretty much ensures that the governments will not be able to meet their very low and low obligations.

Myth: housing more expensive in dense areas

Todd Litman recently gave a talk at Transit 101 presentation hosted by 350Sacramento and others. There were some comments afterwards questioning some of what he had to say and his premises.

One of these was “He also ignores that the type of concentration he is advocating significantly increases the cost of housing.” Litman did present densification as one of the solutions to transit systems that are too spread out to function effectively, which is certainly one of the issues for SacRT.

If one looks only at the price of housing, the cost does usually increase as one moves from the suburbs towards the urban core. Though the pattern is actually much more complicated than that, with some inner-ring suburbs doing quite well while others are in steep decline. But the price of housing is only one aspect of living costs. The big, and often forgotten or dismissed, cost is transportation.

The key resource for exploring the tranportation aspects of housing affordability is the H+T Index (housing plus transportation) of the Center for Neighborhood Technology. To quote:

By taking into account the cost of housing as well as the cost of transportation, H+T provides a more comprehensive understanding of the affordability of place. Dividing these costs by the representative income illustrates the cost burden of housing and transportation expenses placed on a typical household. While housing alone is traditionally deemed affordable when consuming no more than 30% of income, the H+T Index incorporates transportation costs—usually a household’s second-largest expense—to show that location-efficient places can be more livable and affordable.”

The map below shows the H+T index for a part of the Sacramento area. Light colors are affordable, dark colors are not. The general pattern is that housing becomes less affordable the further one goes from the urban core, though the pattern is of course complex. Part of Arden-Arcade is unaffordable both because housing is very expensive and it is a transit desert, while other parts are more affordable because housing is less expensive and it is not quite as much of a transit desert.

CNT_sac-HT

The devil is in the details, so I’d encourage you to explore the maps at CNT in more detail to see how this calulation works for specific areas, and how the H only (housing only) map compares to the H+T (housing plus transportation) map. I’ve written a bit about H+T before (Abogo), but it is always worth coming back to these very important concepts.

A lot of what people think about when they think about high costs in dense places are the really dense places, New York, Paris, San Francisco. However, the high costs of those places has as much to do with demand as with density. These places are expensive because so many people want to live there, and with limited housing options, competition drives prices up. In fact, the lower costs of suburban housing can be explained in large part by the far lower demand for such places. Not many people want the suburbs, so there is little competition for housing there, and prices stay lower. This is an oversimplification, but nevertheless true, and one of the perspectives that needs to be considered when looking at housing prices.

Another aspect of this misunderstanding is that many people envision densification as leading inevitably to very dense urban areas, which they associate with poor livability (though others seek out these dense areas), what are sometimes called inner cities, skyscrapers and tenements. Densification can mean intermediate densities, such as houses on smaller lots, multi-family housing, and buildings of moderate height up to five stories. Of course some people don’t like that either, but this is the minimum necessary for a functional transit system. The “new-traditional” format of houses on large suburban lots, or even worse, very large houses on very large exurban lots, cannot support a transit system. In the Sacramento area, midtown is an example of a moderate density place. It has single family homes, but also multi-family houses, apartment complexes, low-rise residential buildings, a good mix of housing types. And it is hardly dense at all, at least in my view.

Beyond the direct costs to the invidual homeowner/renter, however, are the costs we pay in sales tax and property tax, as well as fees, to build and maintain infrastructure. Infrastructure in less dense areas costs much more per household, or per square foot of floor space. Everything is longer in the suburbs: power lines, water lines, sewer lines, telephone/cable TV lines, roads, freeways, and most specifically distance to amenities. Everything. So far we have hidden that cost by having everyone pay equally for infrastructure, but if people were charged both for initial construction and maintenance by the amount of infrastructure per household or square foot, people who live in the suburbs would be paying much more for their services. As it should be. In fact, most of the suburbs are financially unsustainable since they can never generate enough sales tax, property tax, or fees to pay for what it really costs. That is in part why the suburbs are falling apart – there simply isn’t enough money to keep them going.

The cost of living in denser areas is less, the cost of living in less dense areas is more.

Abogo

AbogoA reference to the Abogo calculator from the Center for Neighborhood Technology (CNT) in Kaid Benfield’s post today sent me there. Abogo is based on CNT’s Housing + Transportation Affordability Index, which I was familiar with, so I’m surprised I’d not noticed Abogo, but now I have.

At right is the calculator result for where I live. Hard to read the legend, but the dark green is less than $1000 per month. Of course I spend a good deal less, $100 for a transit pass plus about $20 a month for bicycle maintenance, but the numbers seem reasonable for others who live in downtown/midtown.

Read More »