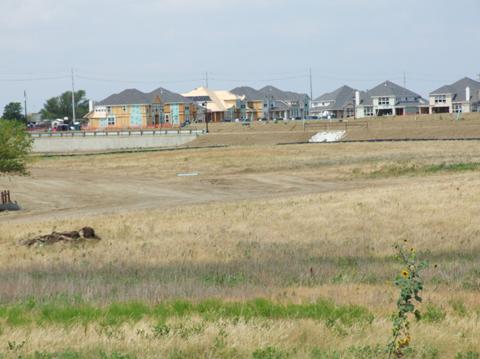
A research paper posted on PLOS entitled Whither the Rangeland?: Protection and Conversion in California’s Rangeland Ecosystems highlights the problem that exists everywhere but is a particular concern in the Sacramento area. Though the paper is pretty science-y, and does not emphasize the carbon impact of rangeland conversion, it is worth a read for all the other impacts and loss of public resources and ecosystem services entailed when rangelands are converted. It say this about Sacramento:
“The vast majority of the development in the Sacramento Metro region occurred in the grasslands and woodlands leading to the Sierra Nevada foothills east of Sacramento, with large conversions directly adjacent to the existing urbanized area (Figure 5).”
The SacBee article “Lost California rangeland is said to pose greenhouse gas risk” puts this rangeland loss in the context of greenhouse gas (GHG) reduction goals required by A.B. 32, the California Global Warming Solutions Act of 2006. From the SacBee article:
A study by UC Davis plant scientist Louise Jackson found that conversion from rangeland to irrigated cropland correlated to a threefold increase in greenhouse gas emissions per unit of land. When rangelands were converted to development, that number increased exponentially. Urban areas account for 217 times more greenhouse gas emissions.
I’ve asked Louise Jackson for more information on this statistics quoted, but so far no response.
My take on all of this is that we cannot possibly meet our climate change goals if we continue to convert rangelands to exurbs. This development form, which Sacramento so dearly loves, and the surrounding counties like as well, is simply not tenable if we are to have a future free of traumatic climate instability and warming. Every greenfield development, which in this area is almost always a conversion of rangelands, must be stopped. Now.

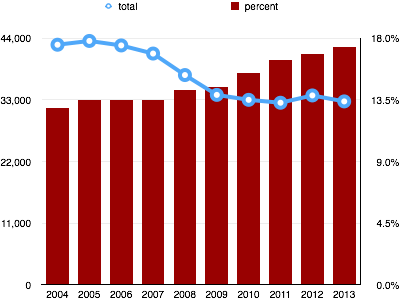 Foxx says “Unfortunately, in the five years from 2009 to 2013, bicyclist deaths were up 15 percent and pedestrian deaths are up 16 percent. In 2013, more than 5,000 pedestrians and bicyclists were killed, and more than 100,000 were injured.” More significant is that pedestrian and bicyclist fatalities are have continued to be an increasing portion of total fatalities. In the chart at right, the blue trend line, of total fatalities is clearly down, and NHTSA (National Highway Traffic Safety Commission) and others have tooted this horn at every chance. What they rarely talk about, and in fact try to hide in their reports, is the other trend, shown by the red bars, that the percentage of fatalities for pedestrians and bicyclists has continually climbed. These are not two unrelated trends. We have spent tremendous amounts of transportation money, and imposed increasing requirements on car manufacturers, in order to reduce the fatality and injury rate of motor vehicle drivers. But this reduction has led to an increase in pedestrian and bicyclist rates. They are inversely correlated to a remarkable degree. This data in the chart is from the