
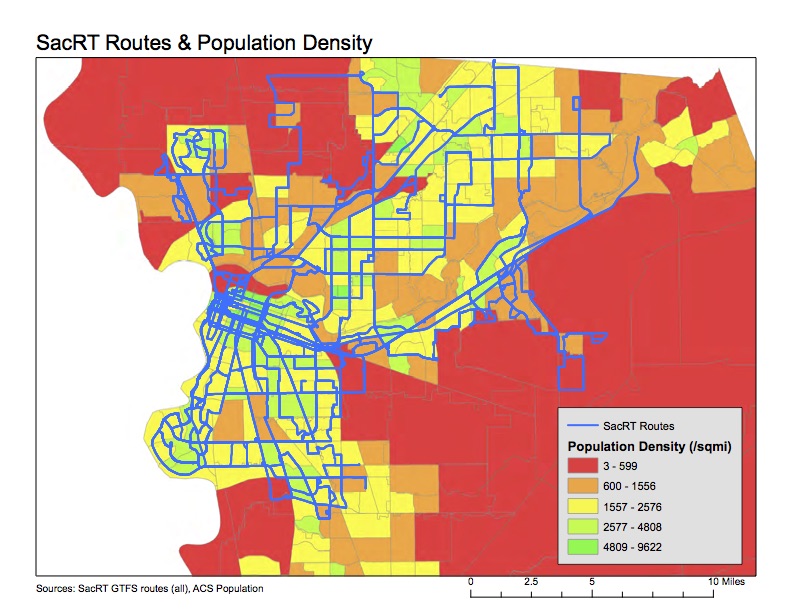
Investigating the proposed SacRT service changes (cuts), I identified that routes serving low density areas are a problem. I developed the map below (pdf SacRT_pop-density) showing routes and population density, with low density areas shown in red. Two routes stand out as servicing primarily low density areas, which are unlikely to ever be productive in a ridership sense. In fact, one of the reasons SacRT struggles to provide efficient transit service is the low-density nature of the county. Though of course agricultural areas north and south of the urbanized area will be low density, there are also large areas of low-density suburb and exurb (sprawl) which will never be successful. Every greenfield development allowed by the county and cities just exacerbates this problem
The population data is from the American Community Survey (ACS) 2014 5-year estimate (S1903), selected by census tract and matched to census tract outlines provided by SACOG, showing residents per square mile. The routes are from the Google Transit Feed Specification (GTFS) provided by SacRT. All routes are shown, including commute hours, low frequency, moderate frequency, and high frequency routes, as well as routes operated by SacRT under contract with others. It would be more useful to identify and/or separate out different kinds of routes, but it takes a while to compile that data, and I’m not quite there yet.
The second map (pdf SacRT_income) is on the same base, but showing median household income. The same data sources are used, except median household income field is used instead of population for each census tract. The red areas show concentrations of low income, or poverty, which are areas that public transit should be serving. Nothing stands out to me as an inappropriate route, but there are services being provided to some pretty high income areas.
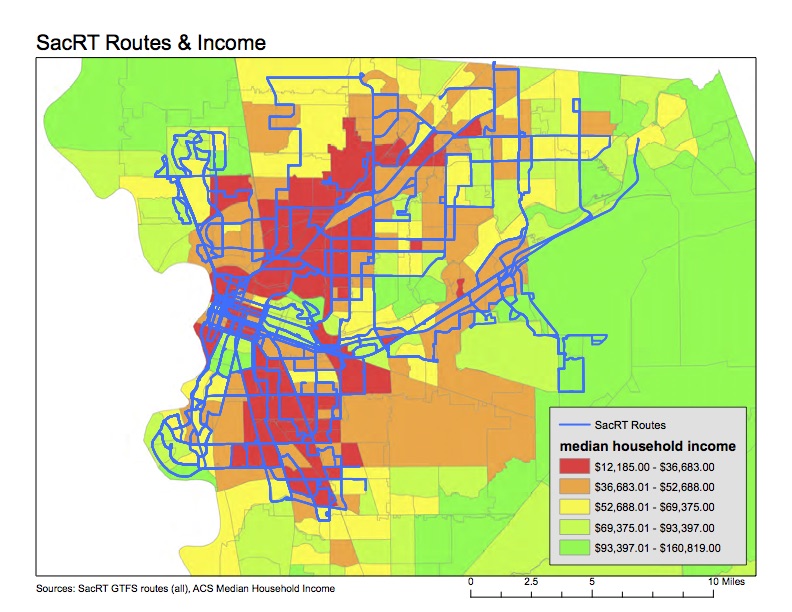
Of course, the primary criteria for a viable transit route is ridership and productivity (the cost per rider), not density or income, but these do serve to identify and perhaps explain low-ridership and low-productivity routes.
I am looking for additional data which might be useful in examining the proposed service cuts, including employement centers, which of course are on the other end many transit trips.

[…] earlier produced maps showing how SacRT routes related to population density and income (SacRT with income and population). I also wanted to present a map on employment or jobs – where people are going to on the […]
LikeLike